教程:开发 Power BI 圆形卡片视觉对象
- 版本 :2023.1(当前版本)
教程:开发 Power BI 圆形卡片视觉对象
在本教程中,你将开发名为“圆形卡片”的 Power BI 视觉对象,以便在圆圈内显示格式化的度量值。 圆形卡片视觉对象支持自定义填充颜色和轮廓粗细。
在本教程中,你将了解如何执行以下操作:
为视觉对象创建开发项目。
使用 D3 视觉对象元素开发视觉对象。
配置视觉对象以处理数据。
配置视觉对象以适应大小更改。
配置视觉对象的自适应颜色和边框设置。
备注
有关此视觉对象的完整源代码,请参阅圆形卡片 Power BI 视觉对象。
先决条件
在开始开发 Power BI 视觉对象之前,请验证本部分中是否已列出所有内容。
Power BI Pro 或 Premium Per User (PPU) 帐户 。 如果没有订阅密钥,可以注册免费试用版。
Visual Studio Code (VS Code)。 VS Code 是用于开发 JavaScript 和 TypeScript 应用程序的理想集成开发环境 (IDE)。
Windows PowerShell 版本 4 或更高版本(适用于 Windows)。 或终端(适用于 OSX)。
准备好开发 Power BI 视觉对象的环境。 设置用于开发 Power BI 视觉对象的环境。
本教程使用“美国销售额分析”报表。 你可以下载此报表并将其上传到 Power BI 服务,或使用自己的报表。 如果需要有关 Power BI 服务和上传文件的详细信息,请参阅开始在 Power BI 服务中创建教程。
创建开发项目
在本部分中,你将为圆形卡片视觉对象创建项目。
备注
在本教程中,Visual Studio Code (VS Code) 用于开发 Power BI 视觉对象。
在 VS Code 中打开一个新终端,并导航到要在其中创建项目的文件夹。
在 PowerShell 终端中输入以下命令:
PowerShell复制
pbiviz new CircleCard在 VS Code 资源管理器中打开 CircleCard 文件夹。 (“文件”>“打开文件夹”)。
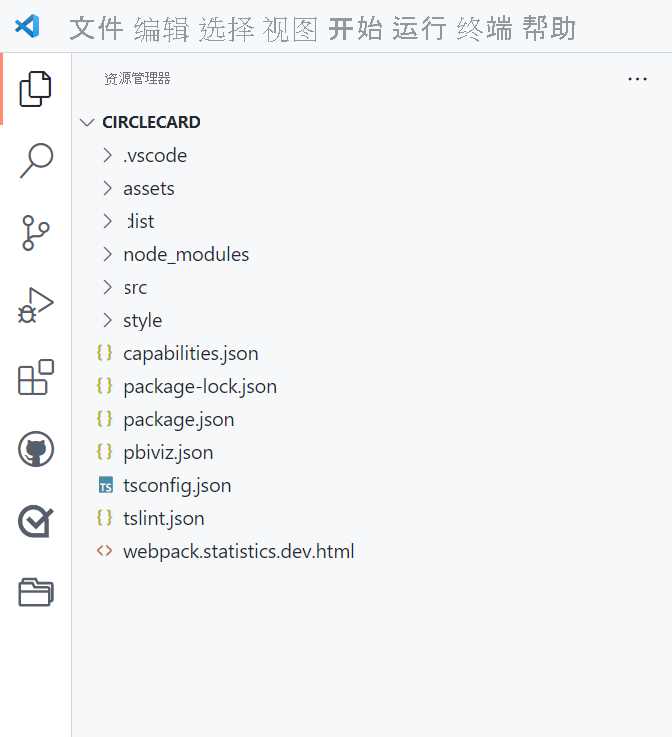
有关其中每个文件的功能的详细说明,请参阅 Power BI 视觉对象项目结构。
检查终端窗口并确认你位于 circleCard 目录中。 安装 Power BI 视觉对象工具依赖项。
PowerShell复制
npm install提示
若要查看视觉对象中已安装了哪些依赖项,请检查 package.json 文件。
启动圆形卡片视觉对象。
PowerShell复制
pbiviz start托管在计算机上的视觉对象现在正在运行。
重要
在本教程结束之前,请不要关闭 PowerShell 窗口。 若要停止运行视觉对象,请输入 Ctrl+C,若系统提示终止批处理作业,请输入 Y,然后按 Enter 。
查看 Power BI 服务中的视觉对象
我们将使用“美国销售额分析”报表,以测试 Power BI 服务中的视觉对象。 你可以下载此报表并将其上传到 Power BI 服务。
你还可以使用自己的报表来测试视觉对象。
备注
在继续之前,请验证是否已启用视觉对象开发人员设置。
登录到 PowerBI.com 并打开“美国销售额分析”报表。
选择“编辑”。

通过单击 Power BI 服务界面底部的“新建页面”按钮,创建用于测试的新页面。

从“可视化效果”窗格中选择“开发人员视觉对象”。
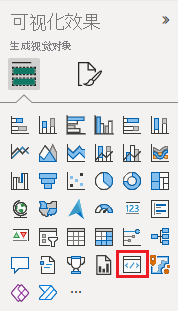
此视觉对象表示在计算机上运行的自定义视觉对象。 仅当启用自定义视觉对象调试设置时,它才可用。
验证是否已向报表画布添加了视觉对象。
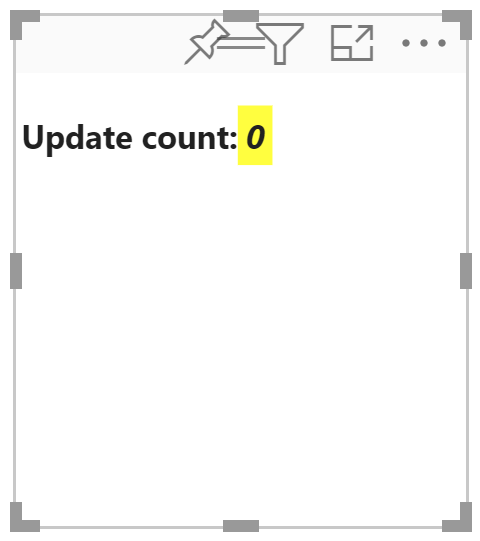
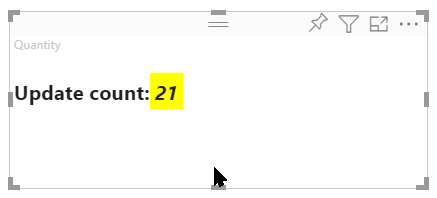
这是一个非常简单的视觉对象,它显示了 update 方法调用的次数。 在此阶段,视觉对象尚未检索任何数据。
备注
如果视觉对象显示连接错误消息,请在浏览器中打开新选项卡,导航到
https://localhost:8080/assets,并授权浏览器使用此地址。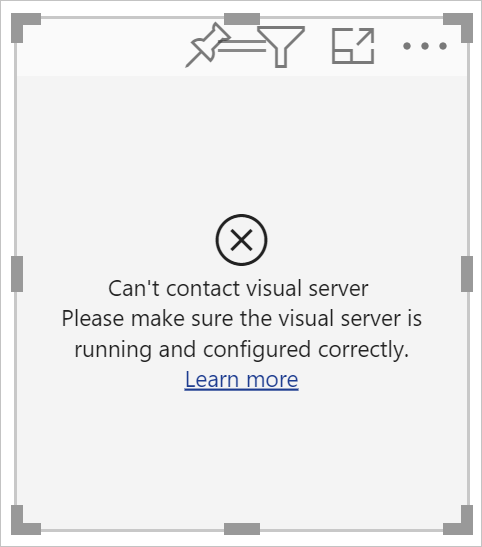
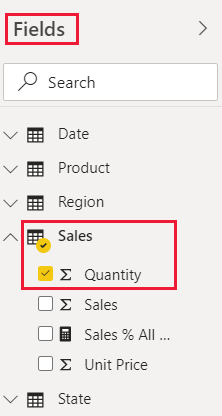
选择新视觉对象的同时,转到“字段”窗格,展开“销售额”,然后选择“数量”。
若要测试视觉对象的响应方式,请调整其大小,并注意“更新计数”值会在每次调整视觉对象大小时递增。
添加视觉对象元素和文本
本部分介绍如何将视觉对象变为圆形并使其显示文本。
修改视觉对象文件
设置 visual.ts 文件。
提示
为了提高可读性,建议每次将代码段复制到项目中时设置文档格式。 在 VS Code 中右键单击任意位置,然后选择“设置文档格式”(Alt+Shift+F)。
在 VS Code 的“资源管理器”窗格中,展开 src 文件夹,然后选择文件 visual.ts。
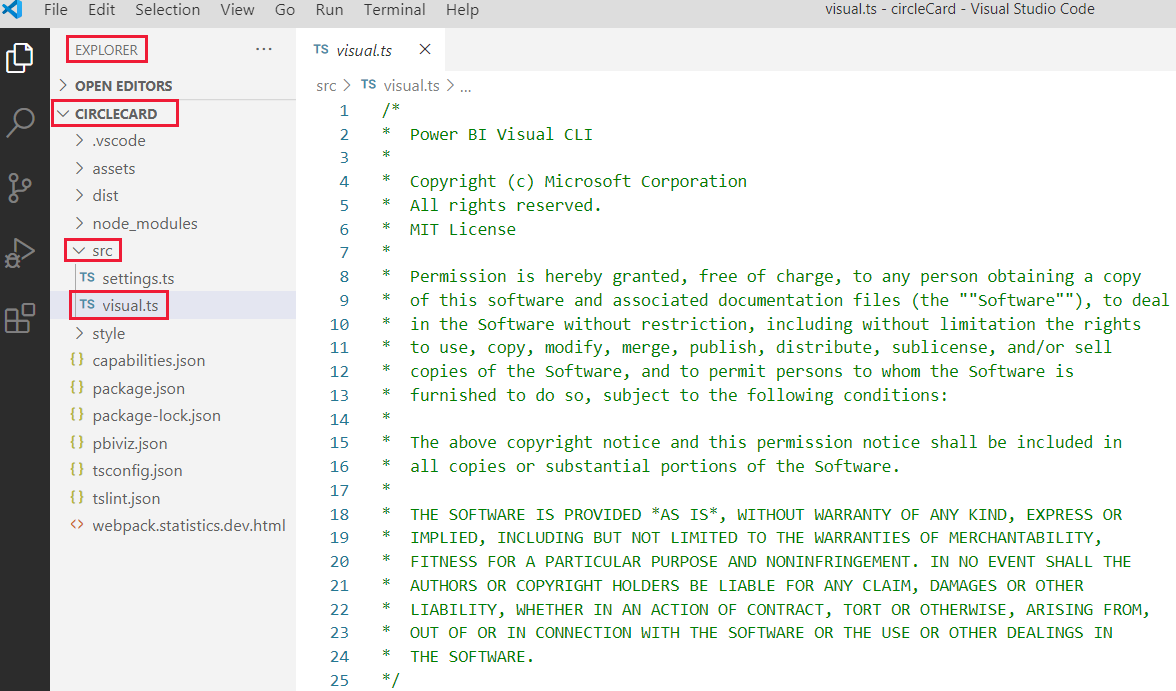
删除 MIT 许可证注释下的所有代码。
重要
请注意“visual.ts”文件顶部的注释。 在麻省理工学院 (MIT) 许可证条款下,免费授予使用 Power BI 视觉对象包的权限。 作为协议的一部分,必须将注释保留在文件顶部。
导入所需的库和模块,并定义 d3 库的类型选择:
TypeScript
"use strict";import "./../style/visual.less";import powerbi from "powerbi-visuals-api";import VisualConstructorOptions = powerbi.extensibility.visual.VisualConstructorOptions;import VisualUpdateOptions = powerbi.extensibility.visual.VisualUpdateOptions;import IVisual = powerbi.extensibility.visual.IVisual;import DataView = powerbi.DataView;import IVisualHost = powerbi.extensibility.IVisualHost;import * as d3 from "d3";type Selectionextends d3.BaseType> = d3.Selectionany, any, any>;备注
如果未在安装过程中安装 D3 JavaScript 库,请立即安装。 从 PowerShell 运行
npm i d3@latest --save请注意,导入的项包括:
IVisualHost - 用于与视觉对象主机 (Power BI) 进行交互的属性和服务的集合。
D3 库 - 用于创建数据驱动的文档的 JavaScript 库。
在导入下,创建一个空的视觉对象类。 视觉对象类实现所有视觉对象开始的 IVisual 接口:
TypeScript
export class Visual implements IVisual {

}
有关视觉对象类中的内容的信息,请参阅 Visual API。 在接下来的三个步骤中,我们将定义此类。
在视觉对象类的开头添加类级私有方法:
TypeScript复制
private host: IVisualHost;private svg: Selection;private container: Selection;private circle:Selection;private textValue: Selection;private textLabel: Selection;请注意,其中一些私有方法使用 Selection 类型。
在构造函数方法中定义圆形和文本元素。 此方法在实例化视觉对象时调用。 D3 可缩放矢量图形 (SVG) 支持创建三个形状:一个圆形和两个文本元素:
TypeScript复制
constructor(options: VisualConstructorOptions) {    this.svg = d3.select(options.element)
        .append('svg')
        .classed('circleCard', true);    this.container = this.svg.append("g")
        .classed('container', true);    this.circle = this.container.append("circle")
        .classed('circle', true);    this.textValue = this.container.append("text")
        .classed("textValue", true);    this.textLabel = this.container.append("text")
        .classed("textLabel", true);
}
在 update 方法中定义宽度和高度。 每当数据或主机环境发生更改(例如新值或调整大小)时,都会调用此方法。
TypeScript复制
public update(options: VisualUpdateOptions) { let width: number = options.viewport.width;let height: number = options.viewport.height;this.svg.attr("width", width);this.svg.attr("height", height);let radius: number = Math.min(width, height) / 2.2; this.circle
.style("fill", "white")
.style("fill-opacity", 0.5)
.style("stroke", "black")
.style("stroke-width", 2)
.attr("r", radius)
.attr("cx", width / 2)
.attr("cy", height / 2); let fontSizeValue: number = Math.min(width, height) / 5; this.textValue
.text("Value")
.attr("x", "50%")
.attr("y", "50%")
.attr("dy", "0.35em")
.attr("text-anchor", "middle")
.style("font-size", fontSizeValue + "px"); let fontSizeLabel: number = fontSizeValue / 4; this.textLabel
.text("Label")
.attr("x", "50%")
.attr("y", height / 2)
.attr("dy", fontSizeValue / 1.2)
.attr("text-anchor", "middle")
.style("font-size", fontSizeLabel + "px");
}保存“visual.ts”文件。
(可选)查看视觉对象文件中的代码
验证 visuals.ts 文件中的最终代码是否如下所示:
TypeScript复制
/*
* Power BI Visual CLI
*
* Copyright (c) Microsoft Corporation
* All rights reserved.
* MIT License
*
* Permission is hereby granted, free of charge, to any person obtaining a copy
* of this software and associated documentation files (the ""Software""), to deal
* in the Software without restriction, including without limitation the rights
* to use, copy, modify, merge, publish, distribute, sublicense, and/or sell
* copies of the Software, and to permit persons to whom the Software is
* furnished to do so, subject to the following conditions:
*
* The above copyright notice and this permission notice shall be included in
* all copies or substantial portions of the Software.
*
* THE SOFTWARE IS PROVIDED *AS IS*, WITHOUT WARRANTY OF ANY KIND, EXPRESS OR
* IMPLIED, INCLUDING BUT NOT LIMITED TO THE WARRANTIES OF MERCHANTABILITY,
* FITNESS FOR A PARTICULAR PURPOSE AND NONINFRINGEMENT. IN NO EVENT SHALL THE
* AUTHORS OR COPYRIGHT HOLDERS BE LIABLE FOR ANY CLAIM, DAMAGES OR OTHER
* LIABILITY, WHETHER IN AN ACTION OF CONTRACT, TORT OR OTHERWISE, ARISING FROM,
* OUT OF OR IN CONNECTION WITH THE SOFTWARE OR THE USE OR OTHER DEALINGS IN
* THE SOFTWARE.
*/"use strict";import "./../style/visual.less";
import powerbi from "powerbi-visuals-api";
import VisualConstructorOptions = powerbi.extensibility.visual.VisualConstructorOptions;
import VisualUpdateOptions = powerbi.extensibility.visual.VisualUpdateOptions;import IVisual = powerbi.extensibility.visual.IVisual;
import DataView = powerbi.DataView;import IVisualHost = powerbi.extensibility.IVisualHost;import * as d3 from "d3";
type Selectionextends d3.BaseType> = d3.Selectionany, any, any>;export class Visual implements IVisual { private host: IVisualHost;
private svg: Selection; private container: Selection; private circle: Selection; private textValue: Selection;
private textLabel: Selection;
constructor(options: VisualConstructorOptions) {
this.svg = d3.select(options.element)
.append('svg')
.classed('circleCard', true);
this.container = this.svg.append("g")
.classed('container', true);
this.circle = this.container.append("circle")
.classed('circle', true);
this.textValue = this.container.append("text")
.classed("textValue", true);
this.textLabel = this.container.append("text")
.classed("textLabel", true);
}
public update(options: VisualUpdateOptions) {
let width: number = options.viewport.width;
let height: number = options.viewport.height;
this.svg.attr("width", width);
this.svg.attr("height", height);
   let radius: number = Math.min(width, height) / 2.2;    this.circle
        .style("fill", "white")
        .style("fill-opacity", 0.5)
        .style("stroke", "black")
        .style("stroke-width", 2)
        .attr("r", radius)
        .attr("cx", width / 2)
        .attr("cy", height / 2);    let fontSizeValue: number = Math.min(width, height) / 5;    this.textValue
        .text("Value")
        .attr("x", "50%")
        .attr("y", "50%")
        .attr("dy", "0.35em")
        .attr("text-anchor", "middle")
        .style("font-size", fontSizeValue + "px");    let fontSizeLabel: number = fontSizeValue / 4;    this.textLabel
        .text("Label")
        .attr("x", "50%")
        .attr("y", height / 2)
        .attr("dy", fontSizeValue / 1.2)
        .attr("text-anchor", "middle")
        .style("font-size", fontSizeLabel + "px");
}
}
修改 capabilities 文件
圆形卡片视觉对象是一个简单的视觉对象,不会在“格式”窗格中创建任何对象。 因此,可以安全地删除文件的 objects 部分。
在 VS Code 中打开项目(“文件”>“打开文件夹”)。
选择“capabilities.json”文件。
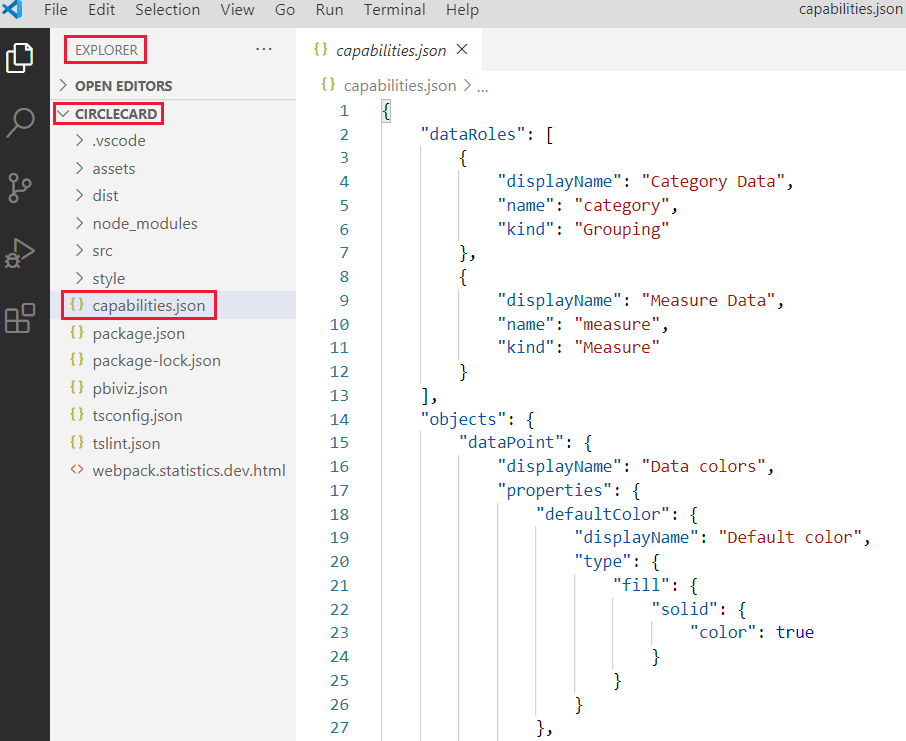
删除整个 objects 数组。
请勿在 dataRoles 和 dataViewMappings 之间留下任何空白行。保存“capabilities.json”文件。
重新启动圆形卡片视觉对象
停止运行视觉对象并重新启动它。
在启动视觉对象的 PowerShell 窗口中,输入 Ctrl+C。 出现提示时终止批处理作业,输入“Y”,然后按 Enter。
在 PowerShell 中,再次启动视觉对象。
PowerShell复制
pbiviz start
使用添加的元素测试视觉对象
验证视觉对象是否显示新添加的元素。
在 Power BI 服务中,打开“Power BI 美国销售额分析”报表。 如果使用其他报表开发圆形卡片视觉对象,请导航到该报表。
将值拖动到“度量值”框中,并确保视觉对象形状为圆形。

如果视觉对象未显示任何内容,请从“字段”窗格,将“数量”字段拖动到开发人员视觉对象中。
调整视觉对象的大小。
请注意,圆形和文本可以根据视觉对象的维度进行缩放。 调整视觉对象的大小时将调用 update 方法,因此会重新缩放视觉对象元素。
启用自动重新加载
使用此设置可确保每次保存项目更改时,都会自动重新加载视觉对象。
导航到“Power BI 美国销售额分析”报表(或包含圆形卡片视觉对象的项目)。
选择圆形卡片视觉对象。
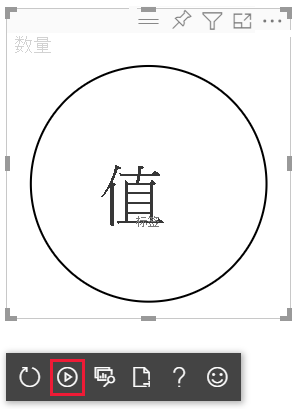
在浮动工具栏中,选择“切换自动重新加载”。
使用视觉对象处理数据
在本部分中,你将定义数据角色和数据视图映射。 还将修改视觉对象以显示它所显示的值的名称。
配置 capabilities 文件
修改 capabilities.json 文件以定义数据角色、对象和数据视图映射。
定义数据角色
使用 measure 类型的单个数据角色定义 dataRoles 数组。 此数据角色称为“measure”,并显示为“Measure”。 它允许传递“measure”字段,或汇总字段。
在 VS Code 中打开“capabilities.json”文件。
删除 dataRoles 数组内的所有内容。
在“dataRoles”数组中插入以下代码。
JSON
{ "displayName": "Measure", "name": "measure", "kind": "Measure"}保存“capabilities.json”文件。
定义数据视图映射
在 dataViewMappings 数组中定义称为“measure”的字段 。 此字段可以传递到数据角色。
在 VS Code 中打开“capabilities.json”文件。
删除 dataViewMappings 数组内的所有内容。
在“dataViewMappings”数组中插入以下代码。
JSON
{    "conditions": [
        { "measure": { "max": 1 } }
    ],    "single": {        "role": "measure"
    }
}保存“capabilities.json”文件。
确认 capabilities.json 文件如下所示:
TypeScript
{    "dataRoles": [
        {            "displayName": "Measure",            "name": "measure",            "kind": "Measure"
        }
    ],    "dataViewMappings": [
        {            "conditions": [
                { "measure": { "max": 1 } }
            ],            "single": {                "role": "measure"
            }
        }
    ],    "privileges": []
}
(可选)查看 capabilities 文件代码更改
验证圆形卡片视觉对象是否显示“measure”字段,并使用“显示数据视图”选项查看所做的更改。
在 Power BI 服务中,打开“Power BI 美国销售额分析”报表。 如果使用其他报表开发圆形卡片视觉对象,请导航到该报表。
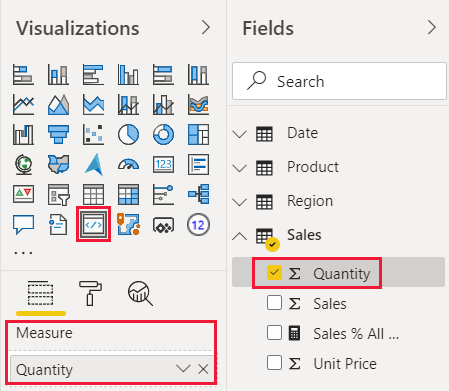
请注意,现在可以使用标题为“Measure”的字段来配置圆形卡片视觉对象。 可以将元素从“字段”窗格拖放到“Measure”字段中。
备注
视觉对象项目尚不包含数据绑定逻辑。
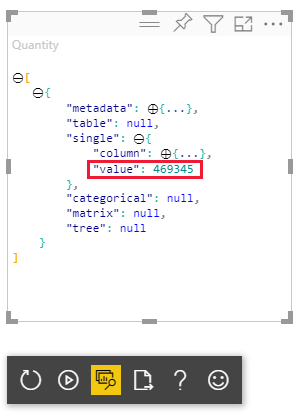
在浮动工具栏中,选择“显示数据视图”。

选择三个点来展开显示,并选择“单个”以查看值。
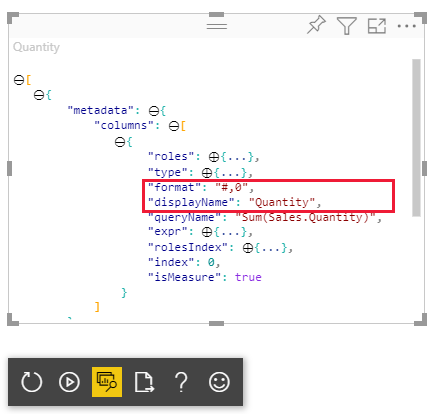
依次展开“元数据”、“列”数组,然后查看“格式”和“显示名称”值。
若要切换回视觉对象,在视觉对象上方浮动的工具栏中,选择“显示数据视图”。
将视觉对象配置为使用数据
到目前为止,视觉对象呈现,但不显示任何数据。 在此部分中,对 visual.ts 文件进行更改,使圆形卡片视觉对象能够使用数据。
在 VS Code 中打开“visual.ts”文件。
在 update 方法中:
添加以下语句作为第一个语句。 此语句将 dataView 分配给一个变量以方便访问,并声明变量来引用 dataView 对象。
TypeScript复制
let dataView: DataView = options.dataViews[0];使用下面这行代码替换 .text("Value"):
TypeScript复制
.text(string>dataView.single.value)使用下面这行代码替换 .text("Label"):
TypeScript复制
.text(dataView.metadata.columns[0].displayName)保存“visual.ts”文件。
查看 Power BI 服务中的视觉对象。
视觉对象现在显示所选数据字段的名称和值。
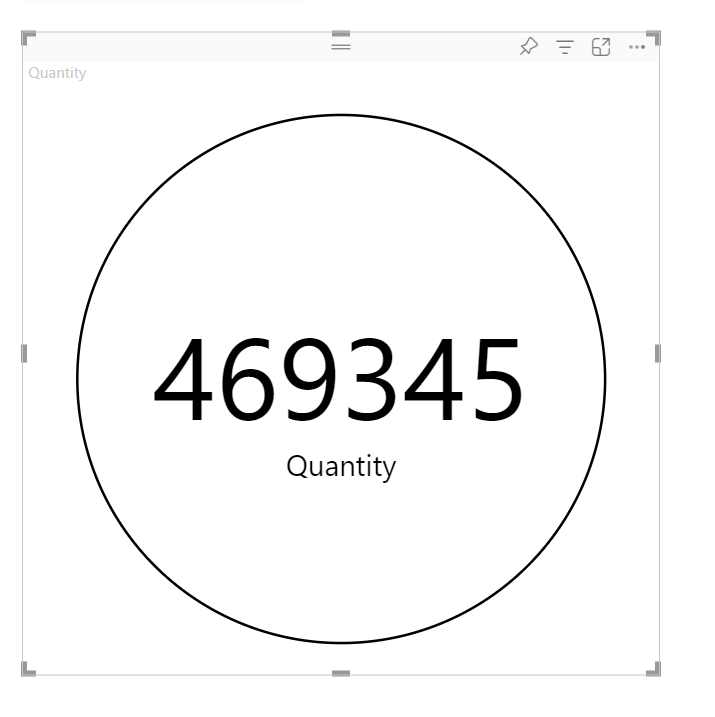
现已创建一个可正常工作的 Power BI 视觉对象。 你可以向其添加格式设置选项,或可以将其按原样打包供立即使用。


