

Lift a chestnut! Tableau Tips (110): Two methods Implement normal distribution Normal distribution
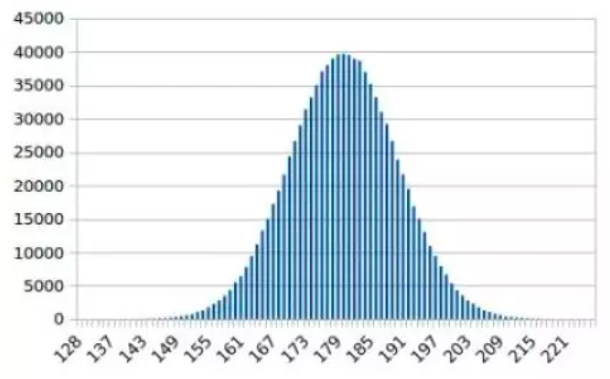
About normal distribution:Normal Distribution, also known as "normal distribution", also named Gaussian Distribution. Normal distribution is an important probability distribution method in statistics, has a wide range of application scenarios in many areas such as mathematics, physics and engineering.
In daily analysis, we often need to monitor data distribution when data is analyzed for business services. Let data implementation of normal distribution is a very effective way of monitoring.
The area of the normal distribution chart horizontal axis reflects the number of examples in this section accounts for a percentage of the total number of cases, or the probability distribution of the variable value falls.
Then, how to achieve normal distribution in Tableau data analysis? Let's share two ways today!
The Tableau tricks that "lift a chestnut" in this issue, the Tableau tricks to share with you are: two ways to achieve normal distribution Normal Distribution.
For your convenience, we use Tableau to own supermarket data sources.
We share two ways to realize normal distribution, and data powder can be selected according to its own ability.
Specific steps are as follows:
[Method 1] Use the calculation field
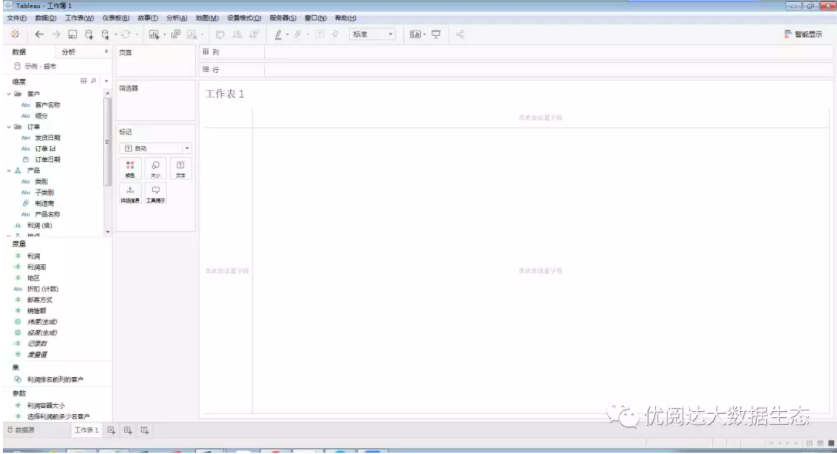
1. Connect the data source
First, we connect to the supermarket data source that come with Tableau.
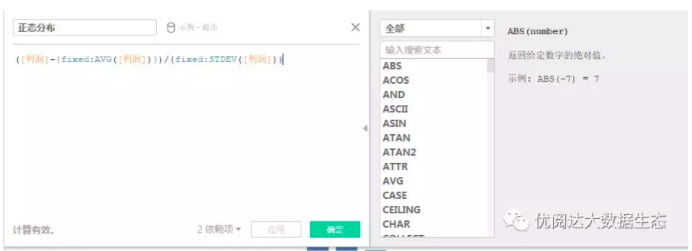
2. Create a calculation field
Next, we create a calculation field: normal distribution
([Profit] - {Fixed: AVG ([Profit])} / {Fixed: stdev ([Profit])}
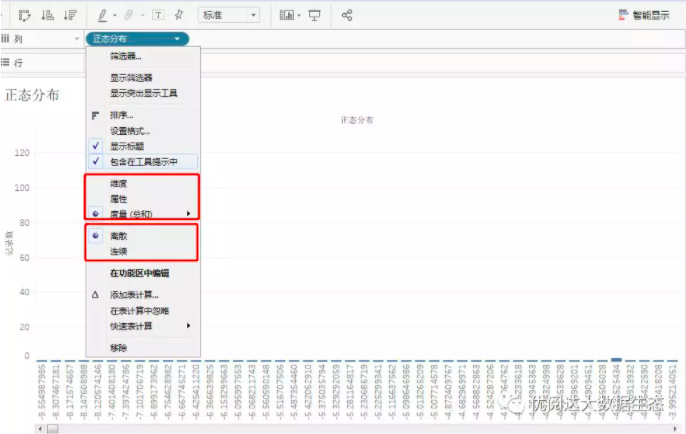
3, modify the field format
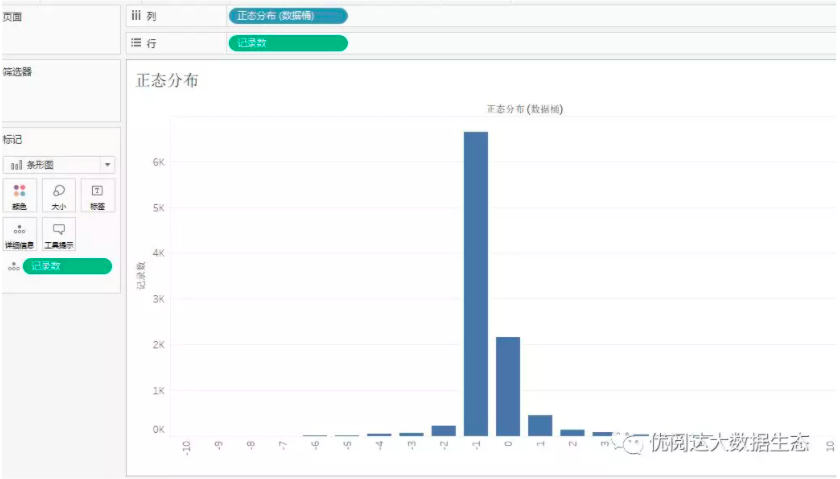
Then, we change the metrics to dimensions and change continuously to discrete; put the record number in detail, as shown below.
4, create a data bucket
Build a data bucket, size is 1 (can be adjusted by self-acting work);
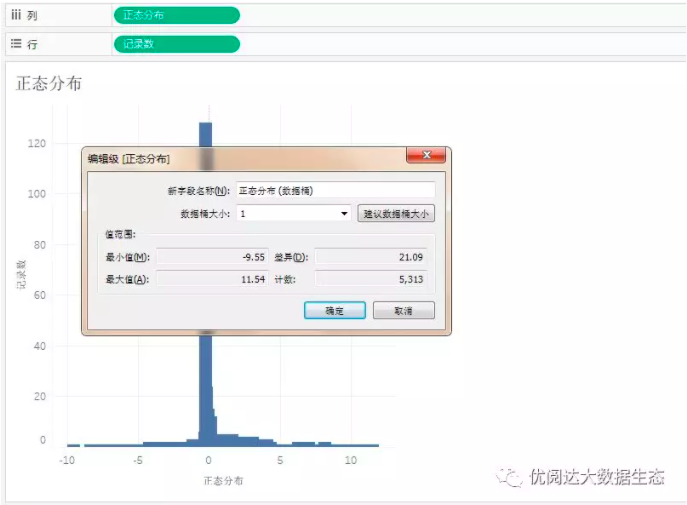
Finally, the graphics are completed.
[Method 2] Connect the R Language
1. Preparation: Install R
First, do preparing: Install R.
You can download the R's installation package on the Internet, pay attention to the R versions of the installation and computer system matching.
Then, open the R language tool.
2, install R language package
Next, we install the R language installation package required by the normal distribution, load and open to prepare the Tableau tool connection.
Command is:
Install.Packages ('Rserve'), Library (Rserve), Rserve (), is as follows:
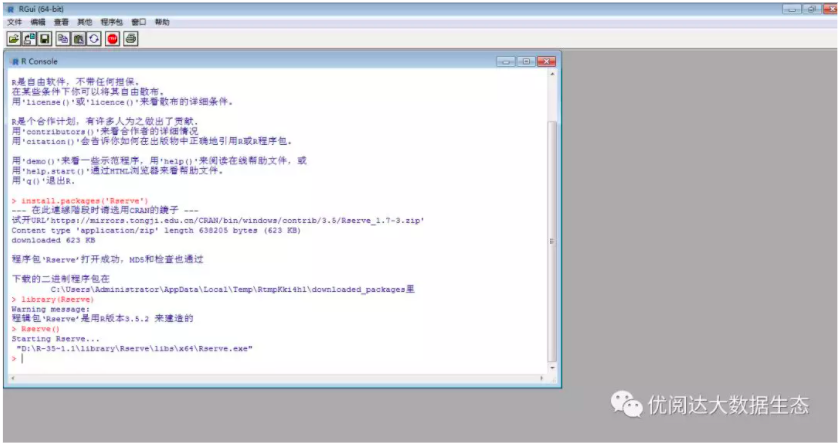
When displaying StartingRserve ...
"D: \ r-35 ~ 1.1 \ library \ Rserve \ libs \ x64 \ Rserve.exe" indicates that it is successful.
At this point, Tableau can be connected.
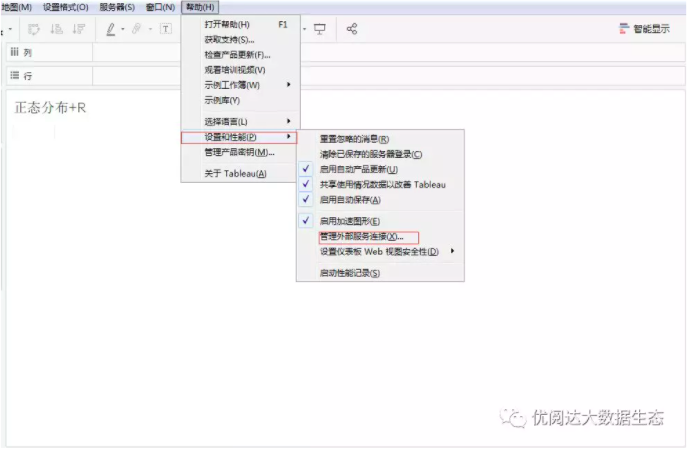
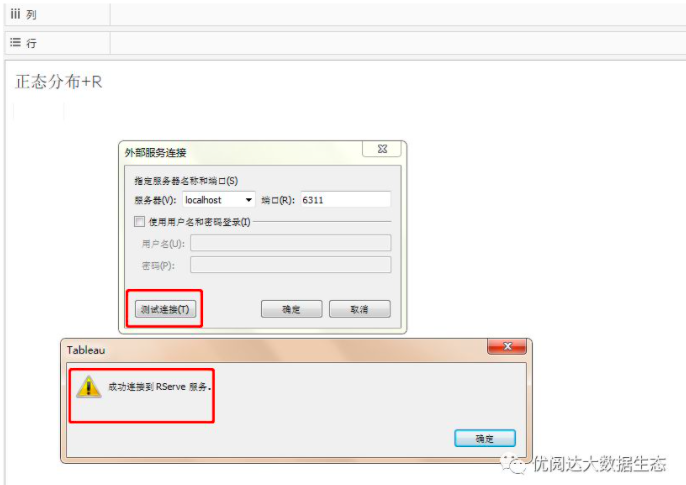
3, connect R
We connect R with Tableau, as shown below.
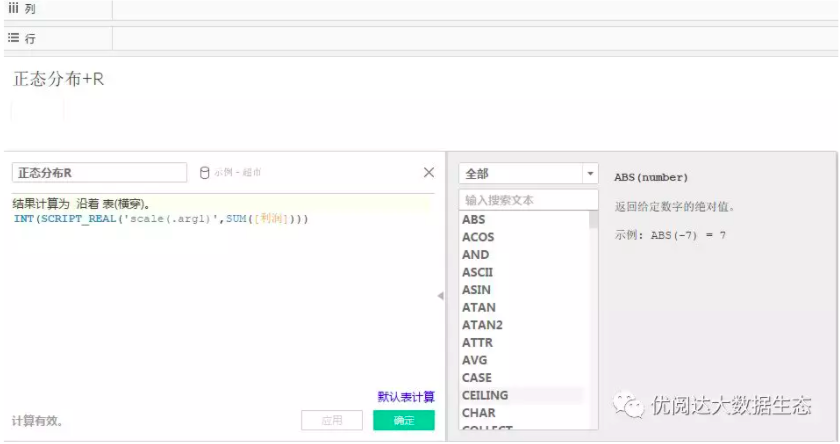
4, create a calculation field
Create a calculation field: normal distribution R
Int (script_real ('scale (.arg1)', SUM ([Profit]))))
Load R is packaged in a packed normal distribution calculation.
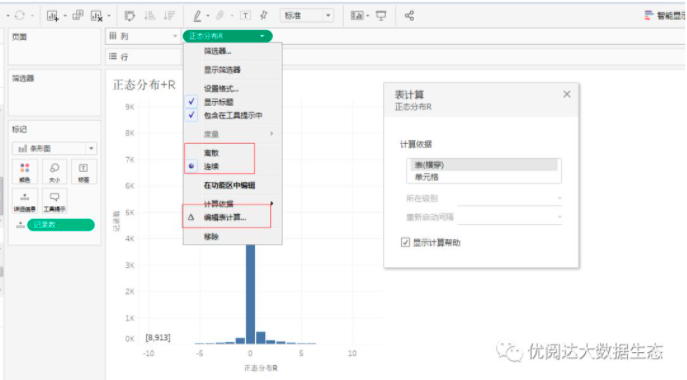
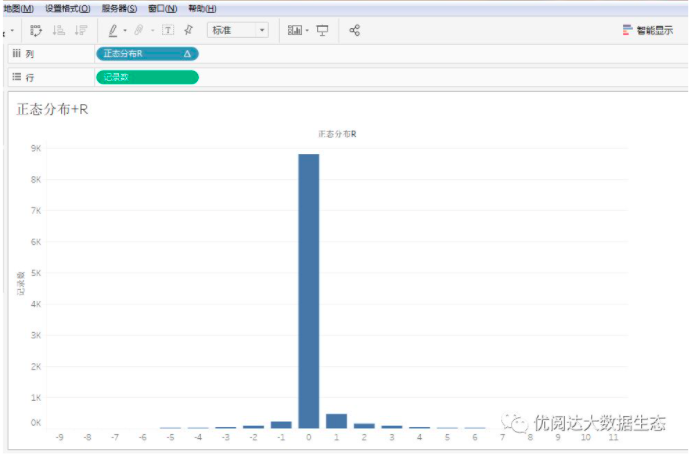
5, adjust the calculation field
Finally, adjust the calculation field to complete the graphics.
This issue of Tableau skills, have you get? Try it quickly!