Give a chestnut! Tableau Tips (13): Use Containers to Realize Maps, Provinces and Cities
Generally, if you want to drill down on the Tableau map, you need to search or filter. With these two methods, not only are there many steps, but each time you can only see the content of a certain province.
Wouldn't it be better if we could combine the maps of the whole country with the maps of provinces and cities (as shown below)?
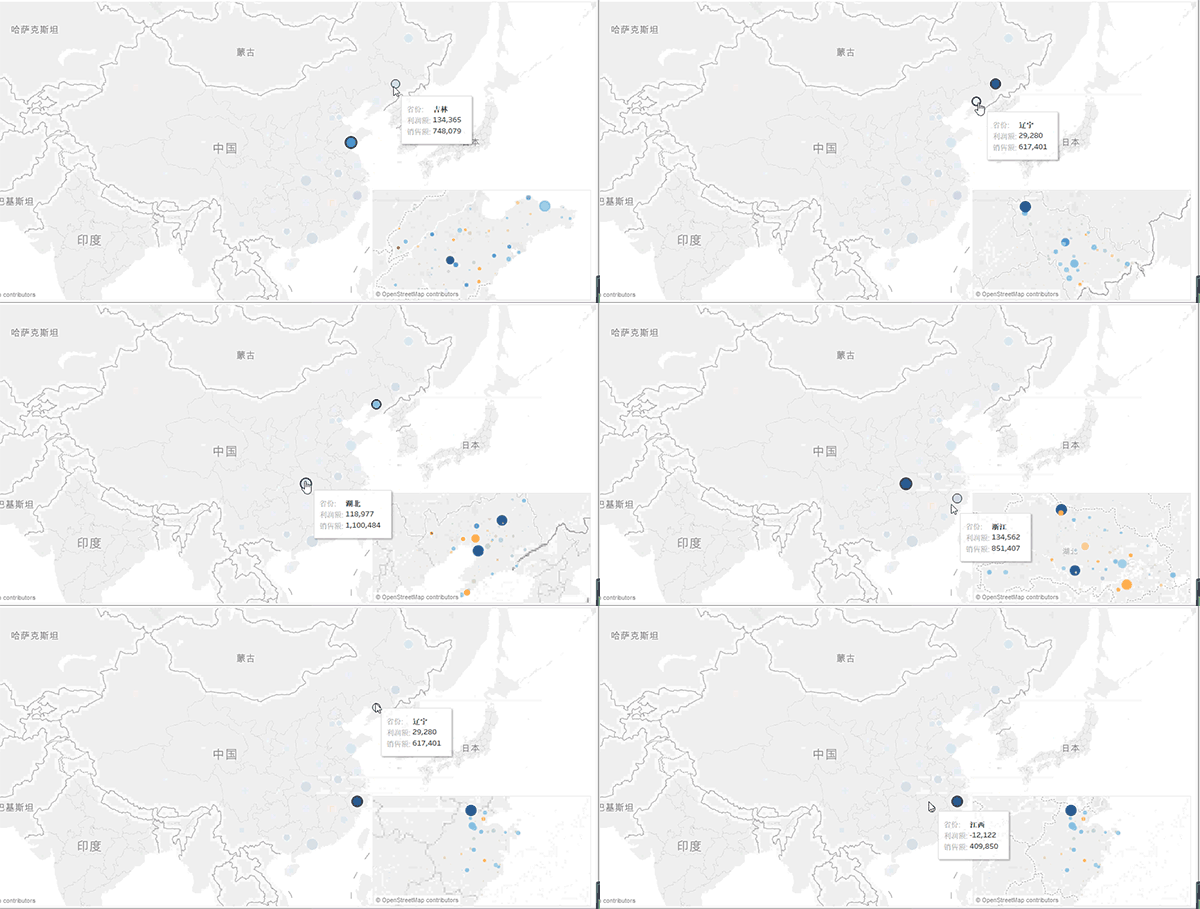
In this issue of "Cite a Chestnut", the Tableau tips that Ada wants to share with you are: use containers to realize maps, provinces and cities details
*Create a province worksheet
Step 1:Create a worksheet about province information, and name the worksheet province
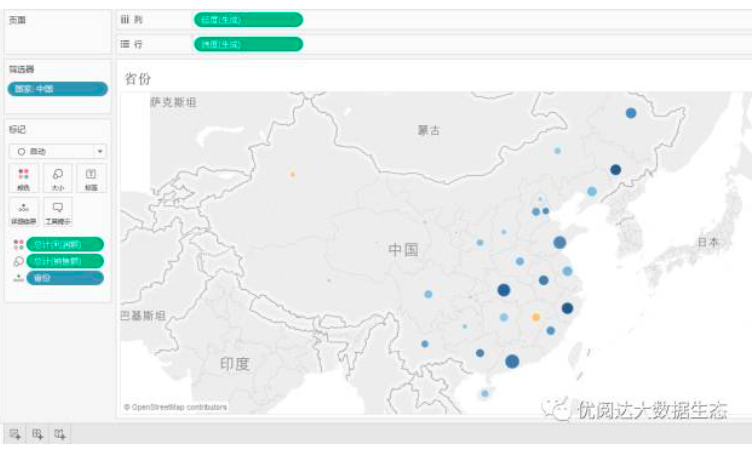
Step 2:Create City Worksheet
Next, we create another worksheet about the city and name the worksheet city.
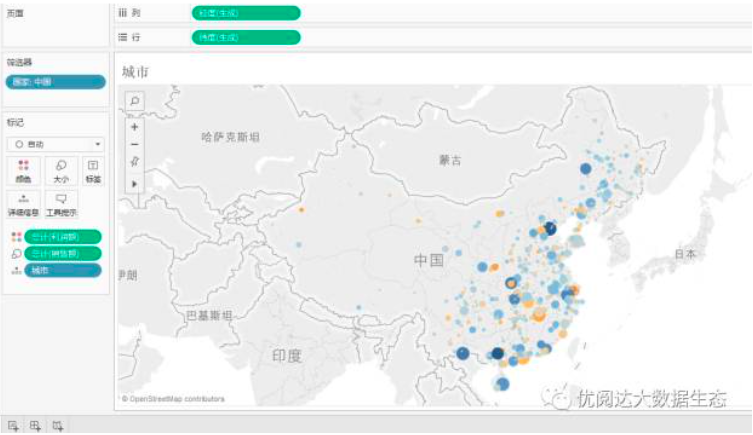
Step 3:Create dashboard and put in container
We create a dashboard, and then put a horizontal container into the dashboard. Note that the container is framed in blue.
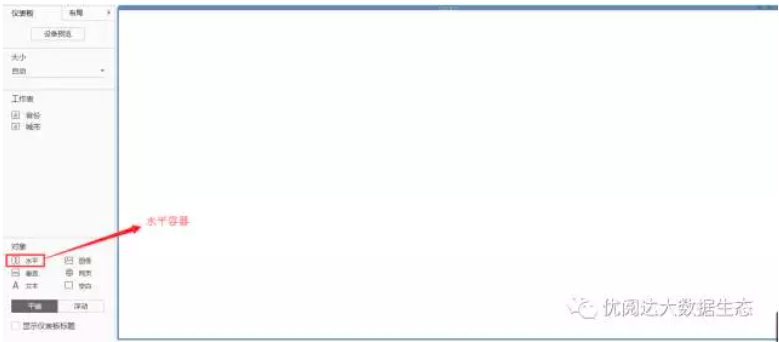
Step 4:Put the worksheet into the container
Put these two tables in the container, then hide the title of the city table.
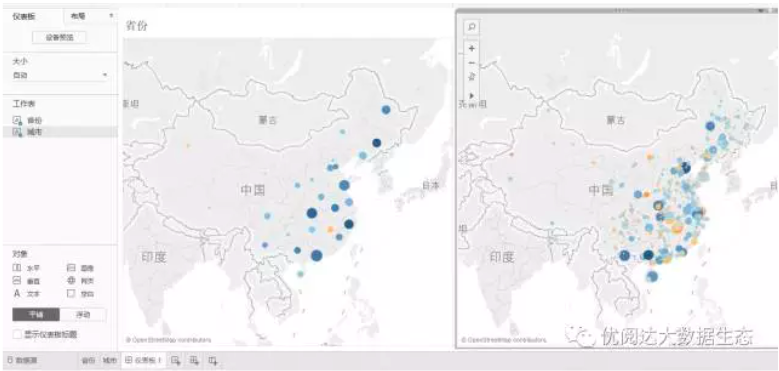
Step 5:Edit filter
Click the dashboard menu, select the operation, and then add the operation as shown below.

Step 6:Change the city worksheet to floating
If you want to achieve a better presentation, just change the city worksheet to floating.
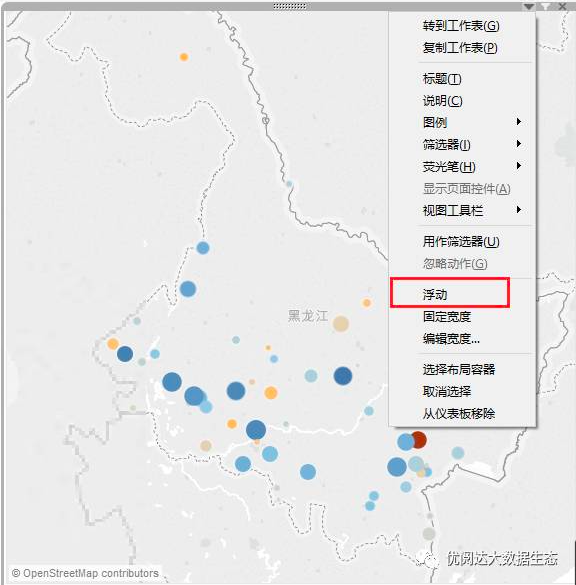
Note: You do n’t need to worry that the small window of that province or city will always be there. Just click on the blank space of the map, and the content of that city will be hidden automatically.

With just a few simple steps, drilling down your map becomes very intuitive. Have you learnt that?


 400 998 0226
 Tableau


 Tableau
 Minitab


 Alteryx


 Neo4j
Neo4j


 Talend


 IM
IM


 华为云
华为云 腾讯云
腾讯云 IT/安全
IT/安全


