透视数据
- 版本 :2022.1 及更高版本
注意:从版本 2020.4.1 开始,您现在可以在 Tableau Server 和 Tableau Online 中创建和编辑流。除非特别说明,否则本主题中的内容适用于所有平台。有关在 Web 上创作流程的详细信息,请参阅Tableau Server(链接在新窗口中打开)和Tableau Online(链接在新窗口中打开)帮助。
有时,在 Tableau 中分析电子表格或交叉表格式中的数据可能很困难。Tableau 希望数据是“高”而不是“宽”,这意味着您通常必须将数据从列透视到行,以便 Tableau 可以正确评估数据。
但是,您可能还会遇到这样的情况:数据表又高又窄,并且过于规范化而无法正确分析。例如,一个销售部门在两列中跟踪广告支出,一列称为广告,其中包含广播、电视和印刷的行,另一列包含总支出。在此类方案中,若要将此数据作为单独的度量值进行分析,需要将该行数据透视到列。
但是,如何透视较大的数据集或随时间频繁变化的数据呢?您可以使用通配符模式匹配来搜索与模式匹配的字段并自动透视数据。
透视数据时,请使用以下选项之一:
将列透视到行
使用通配符搜索可根据模式匹配立即透视字段(Tableau Prep Builder 版本 2019.1.1 及更高版本和 Web 上)。
将行透视到列(Tableau Prep Builder 版本 2019.1.1 及更高版本和 Web 上)。
无论您如何透视字段,都可以直接与结果进行交互,并执行任何其他清理操作,以使数据看起来符合您的要求。您还可以使用 Tableau Prep 的智能默认命名功能自动重命名数据透视字段和值。
将列透视到行
使用此透视选项从宽数据变为高数据。在一组或多组字段上从列透视到行。选择要使用的字段,并将数据从列透视到行。
连接到数据源。
将要透视的表拖到“流程”窗格。
请执行下列操作之一:
Tableau Prep Builder 版本 2019.4.2 及更高版本以及 Web 上:在“配置”窗格中,选择要透视的字段,然后右键单击或按住 Ctrl 键单击 (MacOS),然后从菜单中选择“将列透视到行”。如果使用此选项,请跳到步骤 7。
所有版本:单击加号图标,然后从上下文菜单中选择“添加透视表”。
选择字段(Tableau Prep Builder 版本 2019.4.2 及更高版本以及 Web 上) 流步骤菜单(所有版本) 

(可选)在“字段”窗格中,在“搜索”字段中输入一个值,以在字段列表中搜索要透视的字段。
(可选)选中“自动重命名透视字段和值”复选框,使 Tableau Prep 能够使用数据中的常用值重命名新的透视字段。如果未找到公共值,则使用默认名称。
从左窗格中选择一个或多个字段,然后将其拖到“透视字段”窗格中的“透视 1 值”列中。
(可选)在“透视表字段”窗格中,单击加号图标以添加更多要透视的列,然后重复上一步以选择要透视的更多字段。结果会立即显示在“透视结果”窗格和数据网格中。
注: 您必须选择与在步骤 5 中选择的相同数量的字段。例如,如果您选择了 3 个字段作为初始透视表,则透视表所在的每个后续列还必须包含 3 个字段。
If you didn't enable the default naming option or if Tableau Prep couldn't automatically detect a name, edit the names of the fields. You can also edit the names of the original fields in this pane to best describe the data.
(Optional) Rename the new Pivot step to keep track of your changes. For example "Pivot months".
To refresh your pivot data when data changes, run your flow. If new fields are added to your data source that need to be added to the pivot, manually add them to the pivot.
Example: Pivoting on multiple fields
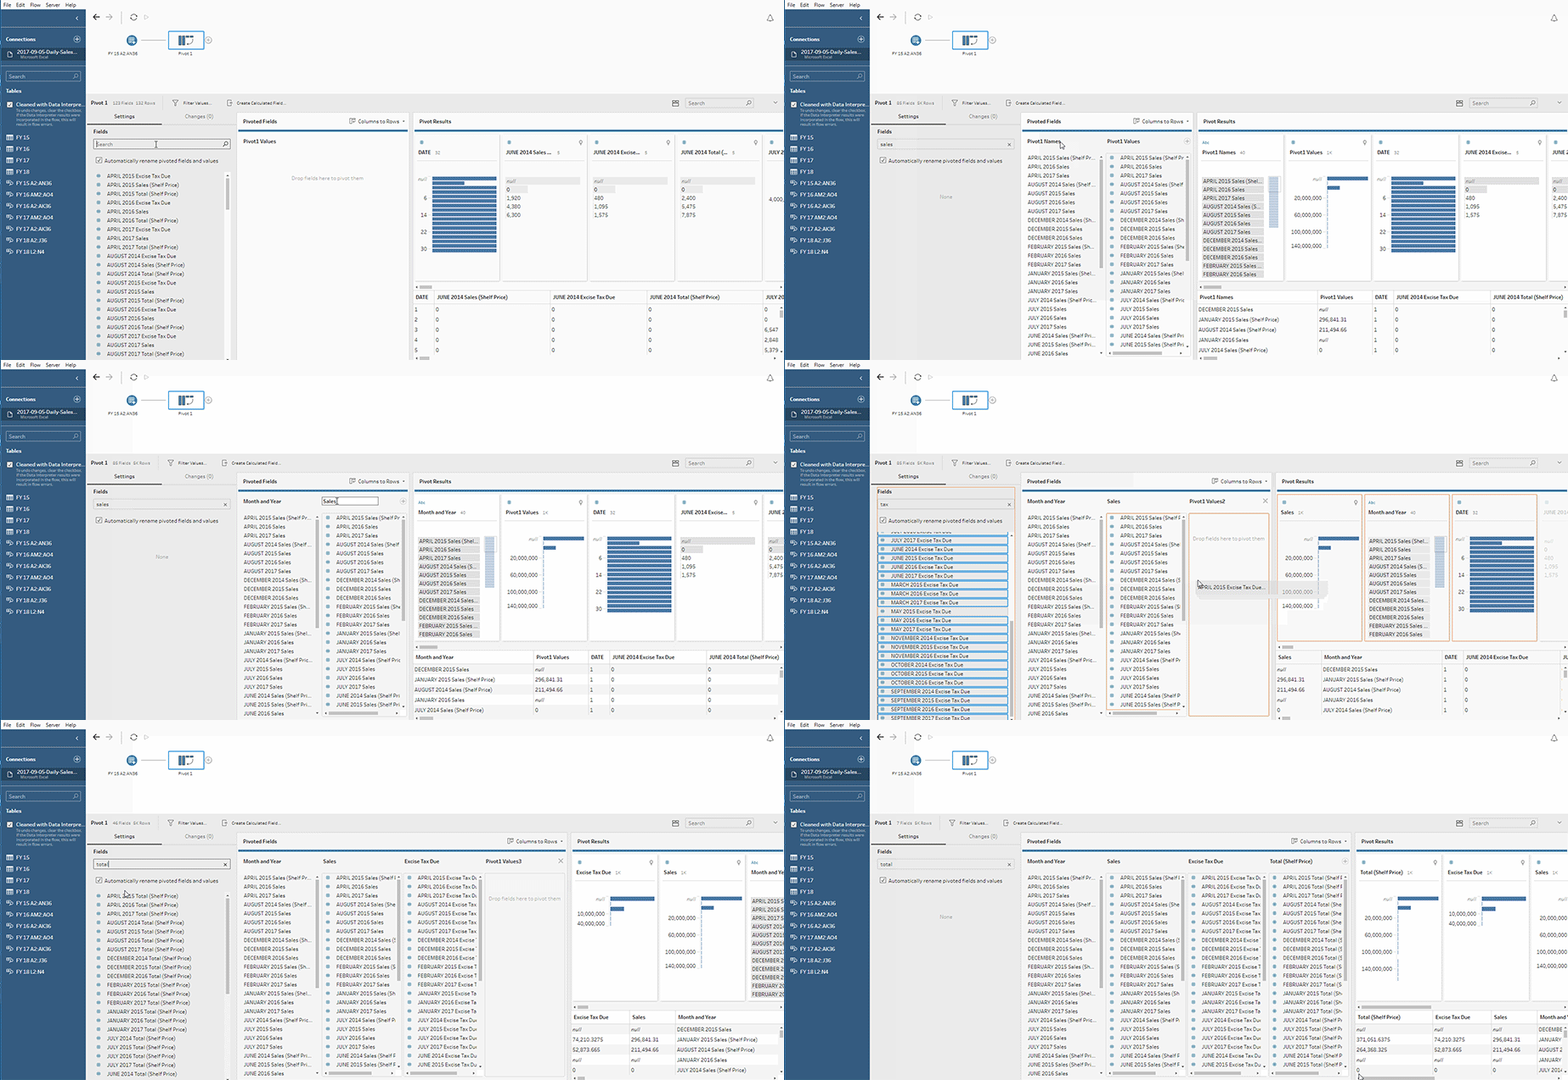
This example shows a spreadsheet for pharmaceutical sales, taxes and totals by month and year.

By pivoting the data you can create rows for each month and year and individual columns for sales, taxes and totals so that Tableau can more easily interpret this data for analysis.

Watch "pivot on multiple field" in action.

Use wildcard search to pivot
If you work with large data sets or if your data frequently changes over time, starting in Tableau Prep Builder version 2019.1.1 and on the web, you can use a wildcard search when pivoting columns to rows to instantly pivot your data based on a wildcard pattern match.
If new fields are added or removed that match the pattern, Tableau Prep detects the schema change when the flow is run and the pivot results are automatically updated.
Connect to your data source.
Drag the table that you want to pivot to the Flow pane.
Click the plus icon, and select Add Pivot from the context menu.
In the Pivoted Fields pane, click on the link Use wildcard search to pivot .

Enter a value or partial value that you want to search for. For example, enter Sales_ to match fields that are labeled as sales_2017, sales_2018 and sales_2019.
Do not use asterisks to match the pattern unless they are part of the field value that you are searching for. Instead click the Search Options button to select how you want to match the value. Then press Enter to apply the search and pivot the matching values.

(Optional) In the Pivoted Fields pane, click the plus icon to add more columns to pivot on, then repeat the previous step to select more fields to pivot.
If you didn't enable the default naming option or if Tableau Prep couldn't automatically detect a name, edit the names of the fields.
To refresh your pivot data when data changes, run your flow. Any new fields added to your data source that match the wildcard pattern are automatically detected and added to the pivot.
If the results aren't what you expect, try one of the following options:
Enter a different value pattern in the Search field and press enter. The pivot will automatically refresh and show the new results.
Manually drag additional fields to the Pivot1 Values column in the Pivoted Fields pane. You can also remove fields that were added manually by dragging them off the Pivot1 Values column and dropping them in the Fields pane.
Note: Fields that were added from the wildcard search results can't be removed by dragging them off the Pivot1 Values column. Instead try using a more specific pattern to match the search results you are looking for.
Pivot rows to columns
In Tableau Prep Builder version 2019.1.1 and later and on the web, pivot rows to columns if your data is too normalized and you need to create new columns - going from tall data to wider data.
For example if you have advertising costs for each month that includes all advertising types in one column, if you pivot the data from rows to columns you can then have a separate column for each advertising type instead, making the data easier to analyze.

You can select one field to pivot on. The field values for that field are then used to create the new columns. Then, select a field to use to populate the new columns. These field values are aggregated and you can select the type of aggregation to apply.
Because aggregation is applied, pivoting columns back to rows won't reverse this pivot action. To reverse a row to column pivot type, you will need to undo the action. Either click the Undo button on the top menu, remove the fields from the Pivoted Fields pane or delete the pivot step.
Connect to your data source.
Drag the table that you want to pivot to the Flow pane.
Click the plus icon, and select Add Pivot from the context menu.
In the Pivoted Fields pane, select Rows to Columns from the drop-down list.
(Optional) In the Fields pane, enter a value in the Search field to search the field list for fields to pivot
Select a field from the left pane, and drag it to the Field that will pivot rows to columns section in the Pivoted Fields pane.
Note: If the field you want to pivot on has a data type of date or datetime, you will need to change the data type to string to pivot it.
The values in this field will be used to create and name the new columns. You can change the column names in the Pivot Results pane later.

Select a field from the left pane and drag it to the Field to aggregate for new columns section in the Pivoted Fields pane. The values in this field are used to populate the new columns created from the previous step.

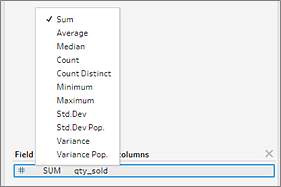
A default aggregation type is assigned to the field. Click the aggregation type to change it.

在“透视结果”窗格中,查看结果并将任何清理操作应用于您创建的新列。

如果要透视的字段的行数据发生更改,请在流程窗格中的“透视”步骤上右键单击或按住 Ctrl 键单击 (MacOS),然后选择“刷新”。


 400 998 0226
 Tableau


 Tableau
 Minitab


 Alteryx


 Neo4j
Neo4j


 Talend


 IM
IM


 华为云
华为云 腾讯云
腾讯云 IT/安全
IT/安全


