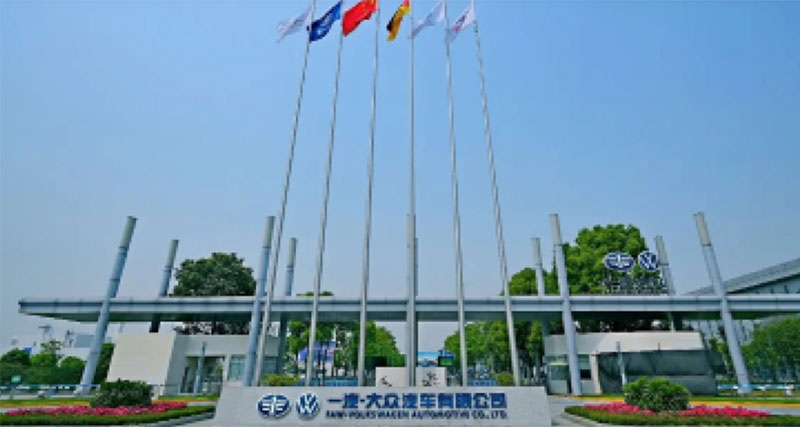
Give a chestnut! Tableau Tips (61): Learn to make three sets of Venn diagrams (Venns diagram) Venn diagram
We often say that Venn diagram (Venn diagram), the scientific name is: Venn diagram (Venn diagram), also known as Wen's diagram. This chart is primarily used to show mathematical or logical connections between different groups of things (sets).
We have shared beforeTwo sets of Venn diagramsThe practice, I wonder if everyone is mastered?
Today, we will improve the difficulty and teach you to use Tableau to make three sets of Venn diagrams (as shown below).
In this issue of "Give a Chestnut", the Tableau technique that Ada wants to share with everyone is: Learn to make three sets of Venn diagrams.
First, we need to prepare the data source. The basic data structure of the Wayne diagram is as follows:
In addition, we need to use the sample-supermarket data source that comes with Tableau.
Specific steps are as follows:
Step 1:Create a calculated field
Name the field "Number of Categories" and enter the formula: { FIXED [Customer Name]: COUNTD ([Category])}.
Drag and drop the created field "Number of Categories" from the measure to the dimension.
Create a calculated field "Category Set" and enter the formula:
CASE [number of categories]
WHEN 3 THEN
"Office Supplies,
technology,
Furniture
WHEN 2 THEN
{FIXED [Customer Name]: MIN([Category])} + ",
"+ { FIXED [Customer Name]: MAX([Category])}
WHEN 1 THEN
[category]
END
Create a calculated field "Category shape" and enter the formula:CASE [number of categories]
WHEN 3 THEN 123
WHEN 2 THEN
(CASE{ FIXED [Customer Name]: MIN([Category])} + "," + {FIXED [Customer Name]: MAX([Category])}
WHEN "Office Supplies, Technology" THEN 12
WHEN "Office supplies, furniture" THEN 13
WHEN "Technology, Furniture" THEN 23
END)
WHEN 1 THEN
(CASE([category])
WHEN "Office Supplies" THEN 1
WHEN "Technology" THEN 2
WHEN "Furniture" THEN 3
END)
END
And drag the field from the measure to the dimension
Create a calculated field "Category Shape Label" and enter the formula:
CASE [number of categories]
WHEN 3 THEN "Office Supplies, Technology, Furniture"
WHEN 2 THEN { FIXED [Customer Name]: MIN([Category])} + "," + {FIXED [Customer Name]: MAX([Category])}
WHEN 1 THEN [Category]
END
Right click on the Category Shape Label and select Alias.
Select the data source: Venn diagram polygon.
Create a calculated field Shape Label, enter the formula: IF[tag]=1 THEN [shape] END, and drag the field from the measure to the dimension.
Step 2:the editorial relationship
In the menu bar, choose Data - Edit Relationships.
Select "Custom" - "Add".
Step 3: create a view
In the tag card, change the tag type to Polygon.
Drag X and Y to the columns and rows, respectively, and right click on Total (X) and Total (Y) to select Measure (Total) - Average.
Drag the Shape to the color and drag the Path ID to the path.
Drag the Venn Chart Number to the filter and select 3.
Click on the color tag card and customize the color. The color settings are as follows (HTML): 1 - #8dc4c6; 2 - #fac497; 3 - #b4e1c6; 12 - #9fa796; 13 - #6bb3aa; ——#dbb87b;123——#8d9f88.
On the column, copy the average (X) (Note: while pressing ctrl, click on the average (X), move slightly to the right, release the mouse when the orange lower triangle appears), and select the two axes.
Right click on the axis and select "Sync Axis".
On the marker card for "Average (X)(2)", change the marker type to "Text" and remove the "Shape" and "Path ID" from the marker card.
Select the data source "Order (example - supermarket)" and click on the "Category shape label" paperclip mark to make it red.
Drag and drop the Category Set and Sales to Text.
Hide the card.
Cancel row and column "Show title".
Select "Settings" - "Line".
Both Gridlines and Zeros are set to None.
Select the boundary and set the Row Separator and Column Separator to None.
In this way, the three sets of Venn diagrams are fixed.
If you think this is a bit difficult, I suggest you learn first.Two sets of Venn diagrams. Of course, if you already have a good grasp of the data powder, you can also try four sets or five sets of Venn diagrams!
Today's Tableau trick, are you getting it?Open your Tableau and try it out!