


 400 998 0226
 Tableau


 Tableau
 Minitab


 Alteryx


 Neo4j
Neo4j


 Talend


 IM
IM


 华为云
华为云 腾讯云
腾讯云 IT/安全
IT/安全


Lift a chestnut! Tableau Tips (119): Number of continuous orders for repurchase analysis
Regarding the repurchase analysis, the previous post uses the Fixed function to realize customer repurchase analysis, you can understand the cycle of the second purchase (repurchase) of the customer (usually how long it will be repurchased), as shown below.

In fact, there is a common analysis requirement, for example, I want to know how many customers who have purchased products in November, how many people continue to buy in December.
In other words, we need to resolve: How to calculate the customers purchased in the month, the number of people who continue to order in the next month (the second purchase of the same month)? Today, we share two ways.
The Tableau tricks "Holding a chestnut", the Tableau tricks to share to everyone is: the number of people who repurchase analysts.
For your convenience, we use Tableau to own supermarket data sources. After mastering the method, data powder can try to use other data sources.
Specific steps are as follows:
【Method 1: Merge set】
TIPS: This method is suitable for calculating the short-term (1-2 time period) repo, if you need to calculate the number of people having a continuous order in 3 time periods, use the second method.
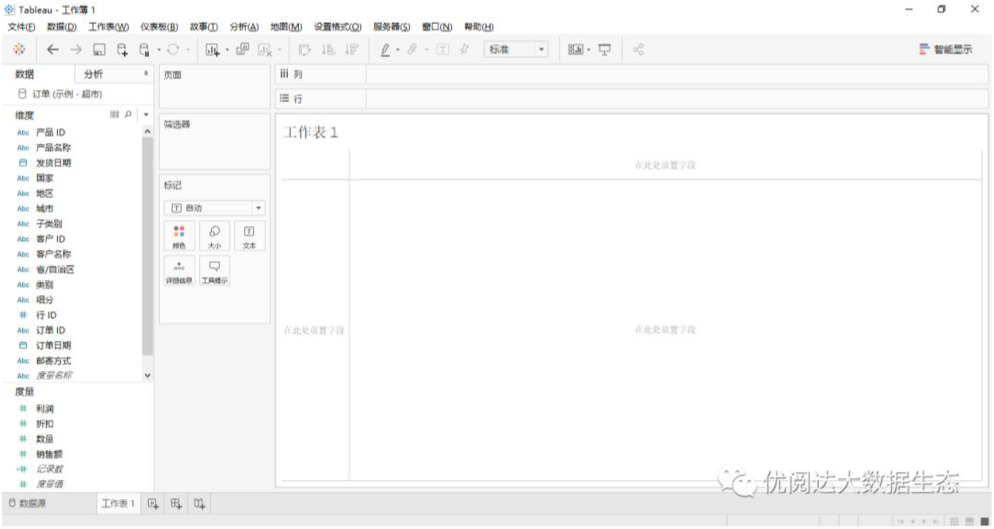
1. Connect the data source
First, we connect to the supermarket data source that come with Tableau.
2, create customers set November and December
Then we drag the customer name to row.
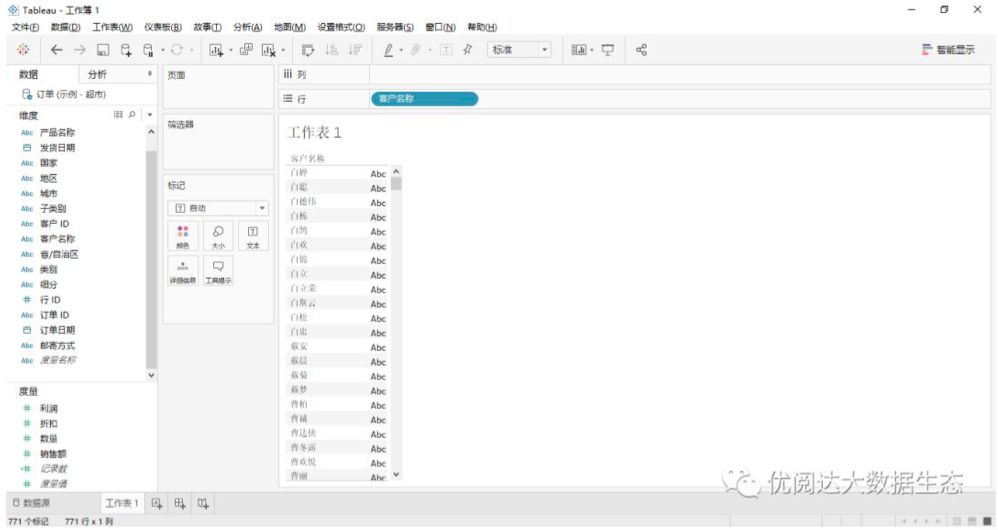
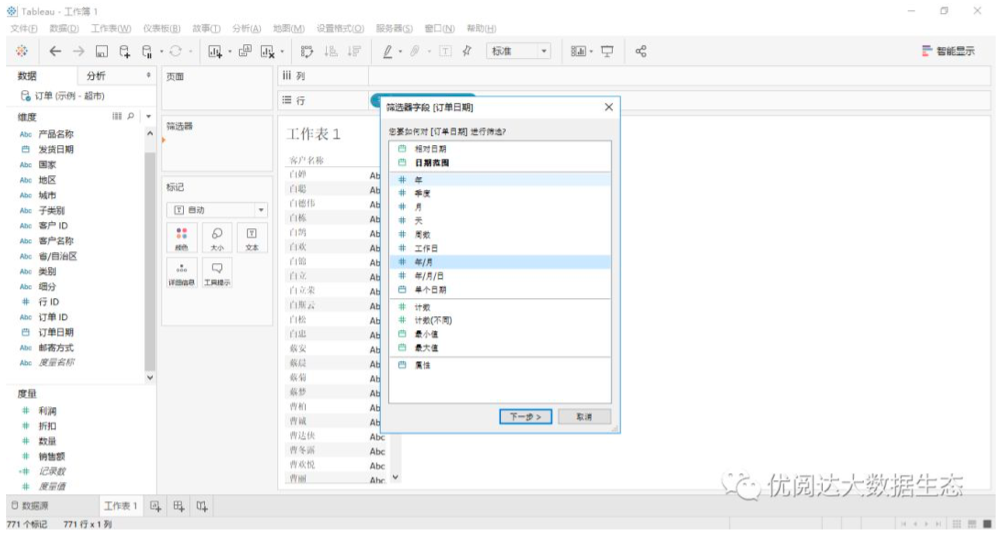
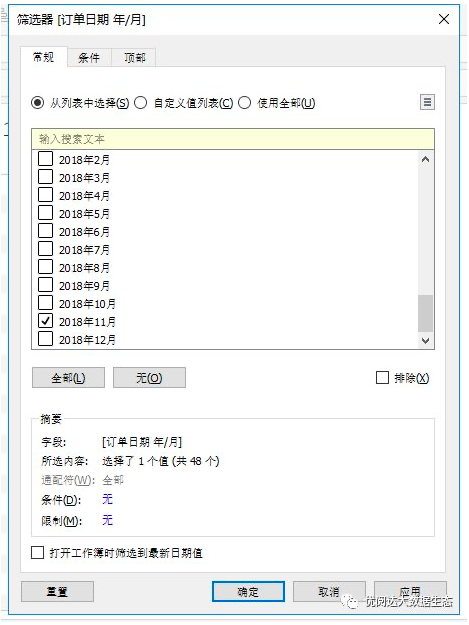
Order Date Select November 2018.
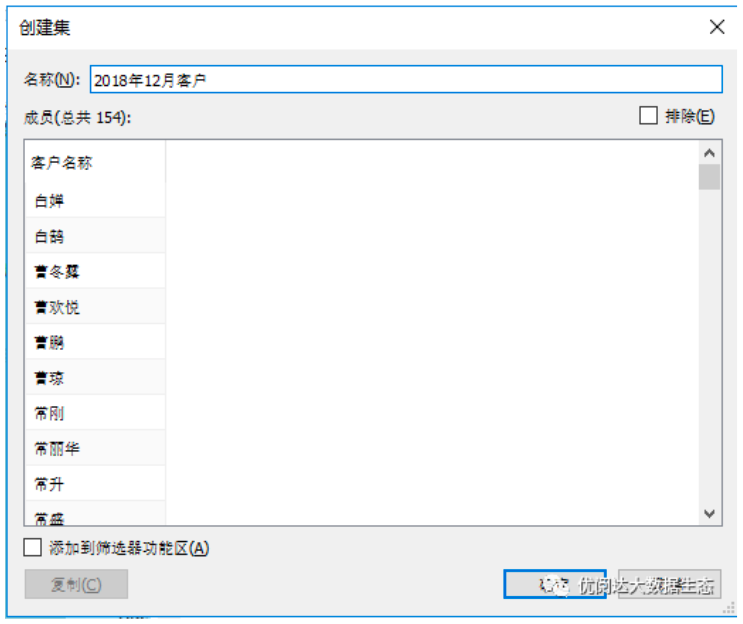
Click on the first customer name, move the scroll bar, hold down the Shift key, and click the last customer and select Create Set.

Name this set as November 2018 customers.

Use the same method to select the order date as December 2018, create a customer set in December 2018.
3, create a merger set of customers and December customers in November

Then, hold down the CTRL button, and click on November 2018 and the December 2018 customer set, select Create a merge set, select two set-in-one shared members, and named: 2018.11 & 2018.12 A total of customers.

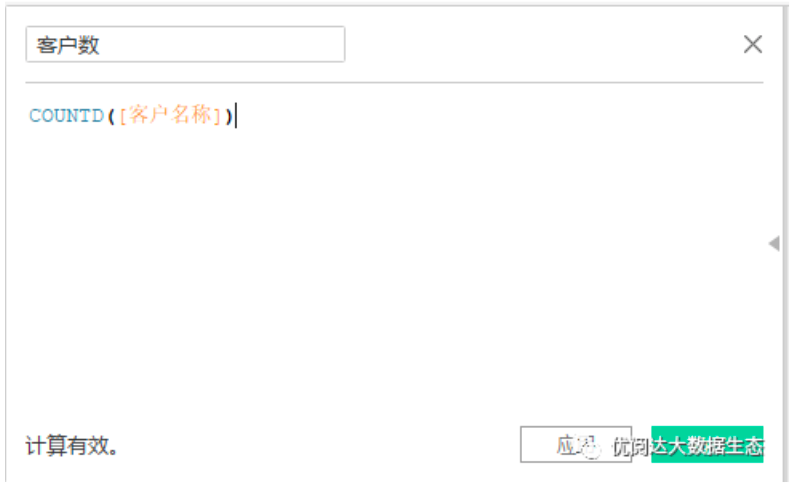
4, create a calculation field
Create a calculation field customer, formula is:
CountD ([Customer Name])
5. Create a chart
Finally, drag the calculation field customer to the row, and drag the 2018.11 & 2018.12 Customer Set to the filter.
In this way, the number of people who have received "customers who purchase products in November 2018 and continue in December".

【Method 2: Using the LOD function】
TIPS: If you want to calculate the number of people having a continuous order in the above, the method cannot be implemented. We need the second method to use the LOD function.
1. Create a calculation field
After connecting the Tableau's own supermarket data source, we need to create a calculation field: there is a month of the order. The formula is as follows:
{FIXED [Customer Name]: countd (Datetrunc ('Month', [Order Date])}

Conversion of the month number of orders into dimensions.

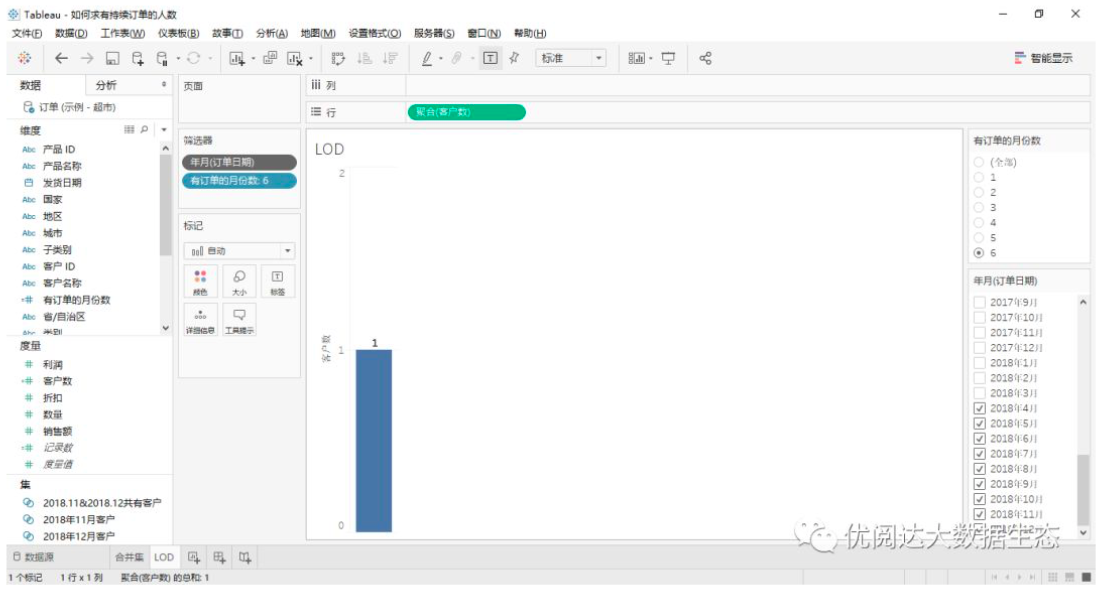
2. Create a chart
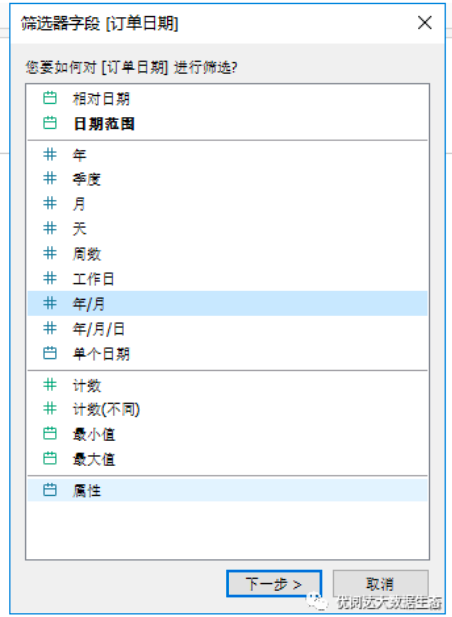
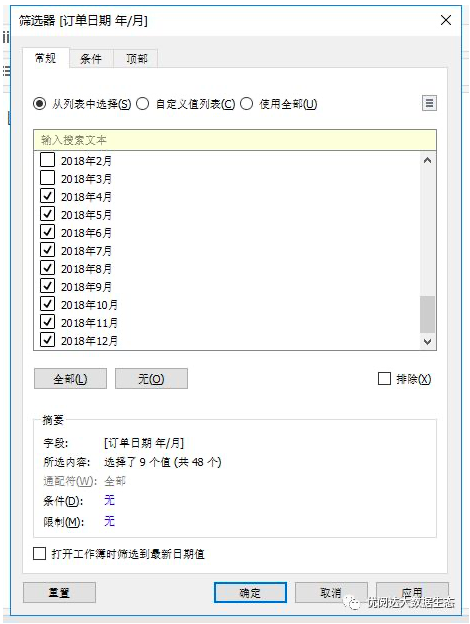
Drag the number of customers to the row, and then drag the order date to the filter, filtering for many months.
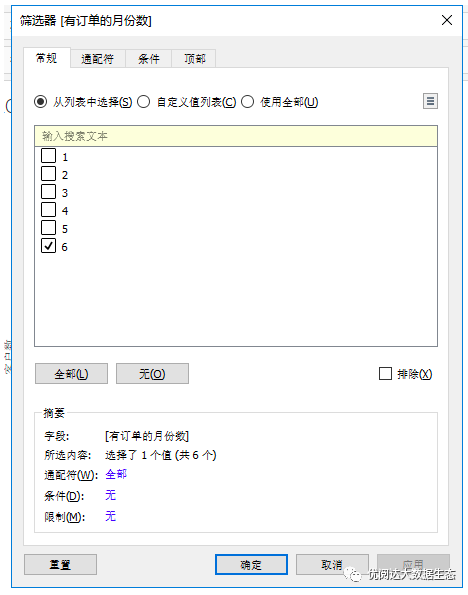
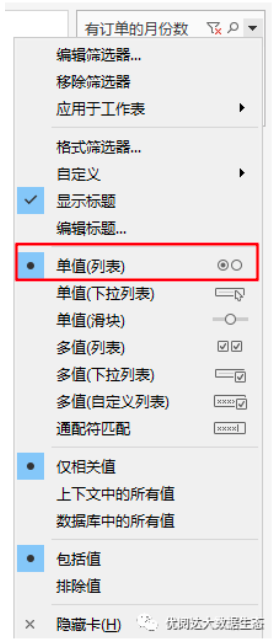
Drag the calculated fields or orders to the filter, order number selection 6, and will be set to a radio value.
In this way, you can get: There are also number of people who purchase products in the last half of the year.
This issue of Tableau skills, have you get? Try it quickly!