


 400 998 0226
 Tableau


 Tableau
 Minitab


 Alteryx


 Neo4j
Neo4j


 Talend


 IM
IM


 华为云
华为云 腾讯云
腾讯云 IT/安全
IT/安全


Give a chestnut! Tableau Tips (85): Using Scale to Present Data Composition
When analyzing business data, we often encounter the analysis needs of the ratio. Although the percentage is a common presentation method, it does not necessarily apply to all scenarios.
For example, analysis of personnel composition or analysis of ingredient composition may be more appropriate in a proportional manner (1:N, or 1:N:M).
How to achieve scale rendering in Tableau? Let's share the method today.
In this issue of "Give a Chestnut", the Tableau technique that Ada wants to share with everyone is: use scale to present the data composition.
For the convenience of learning, we use the supermarket data that comes with Tableau.
Specific steps are as follows:
【1 : Type N goal: The ratio of sales in the office category to sales in the technology category.】
01 Create a calculated field
First, we need to first create three calculated fields:
1) Sales of office supplies
2) Sales in the technical category
The picture below shows the sales of office supplies. The second field, “Technical category sales”, is created in a similar way, with the need to change office supplies to technology.

3) Office supplies: technology
As shown in the figure below, it should be noted that this is the inverse of the actual ratio, which is prepared for the display 1:N, so 1/ is added to the front.

02 Drag the calculated field into the text field
Next, we drag the calculation field of "Office Supplies: Technology" into the text field.

03 format
Right click on the number in the worksheet and select Format.

Then, select the calculation field Office Supplies: Technology.

Select the customization in the number and change it to the following form in the format.
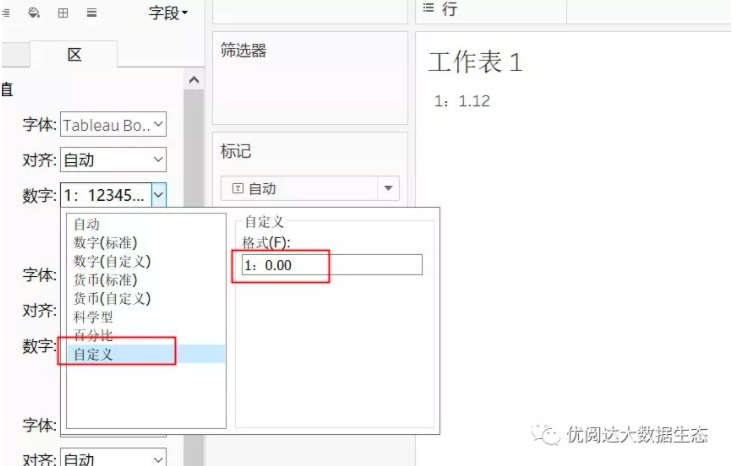
Tips: It is important to note that the colon here must be a colon under the Chinese input method, otherwise Tableau will treat it as a calculated field and will not achieve the desired effect.
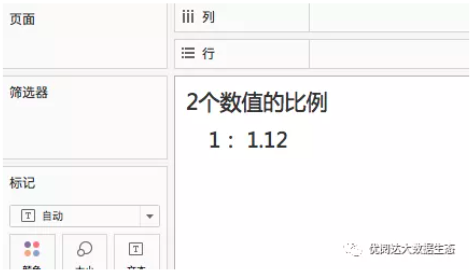
In this way, a 1:N ratio is presented (as shown below).
【1 : N : M Type Objective: To achieve the ratio of office supplies sales to technical sales and furniture sales.】
01 Create a calculated field
The method of this step is basically the same as "1:N type".

Calculations for the third category Fields: Furniture sales and office supplies: Furniture, the field of the ratio is also plus 1 in front.

02 Drag the calculated field into the text field

Drag the calculated fields of the two ratios into the text field in the marker bar as shown below.
03 edit label
Click on the text in the marker bar, then click the three-point button to the right of the text to enter the Edit tab window and write the format as shown below.

In this way, the ratio of 1:N:M is achieved (as shown below).

Today's Tableau trick, are you getting it?Open your Tableau and try it out!