

Lift a chestnut! Tableau Tips (128): Implementing a Six Sidement Machine Map with Space Files (Cellient Map)
In actual analysis scenario, when you need to analyze data according to geographical domain, you can directly use the map to pass a lot of geographic information, it is difficult to highlight the data information you want to express.
How to more highlight data information and ignore geographic information? Use a hexagon mesh map (cellular map) will be a good choice.
As shown in the figure below, each hexagon represents a geographic area (example as China), each region is based on its substantially geographical distribution, and it is easy to obtain data conclusions through color.
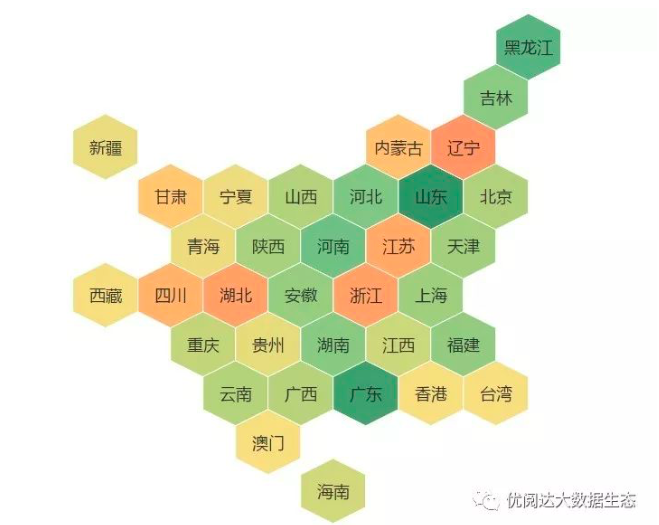
So, how to implement a hexagon mesh map in Tableau, share the method today!
The Tableau tricks we want to share with you this issue are: Use space files to achieve a hexagon mesh map (cellular map).
For the convenience of learning, chestnuts use Tableau to own the "example-supermarket" data source. After mastering the chestnut method, the data powder can try to use its own data.
Specific steps are as follows:
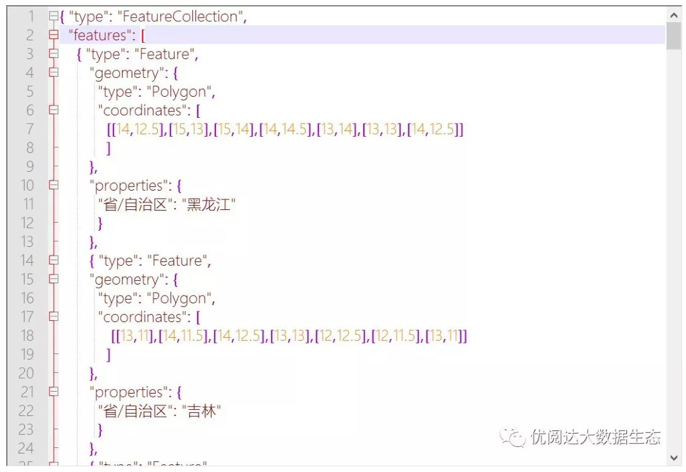
1, make spatial files
Making space files, as shown below (Take Geojson as an example):
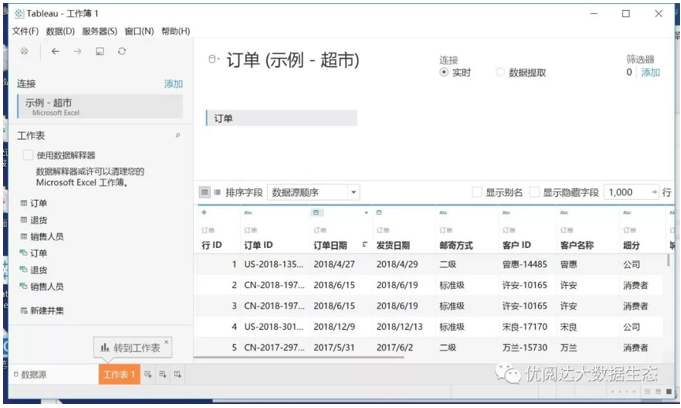
2, connection space file
Open Tableau Desktop to connect to the "example-supermarket" data source that comes with Tableau.
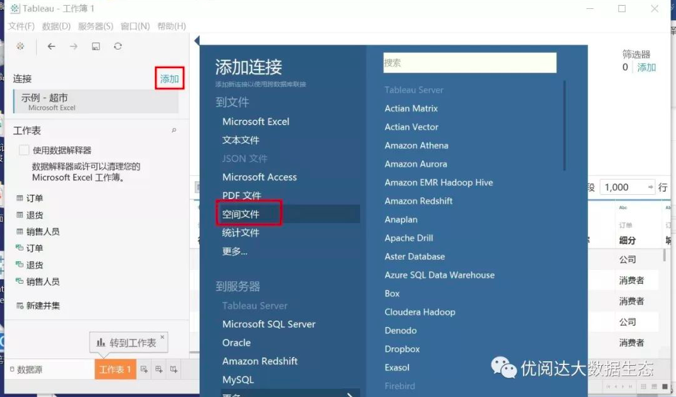
Next, add the spatial file just made.
In the data source work interface, the connection mode is modified to the right connection.
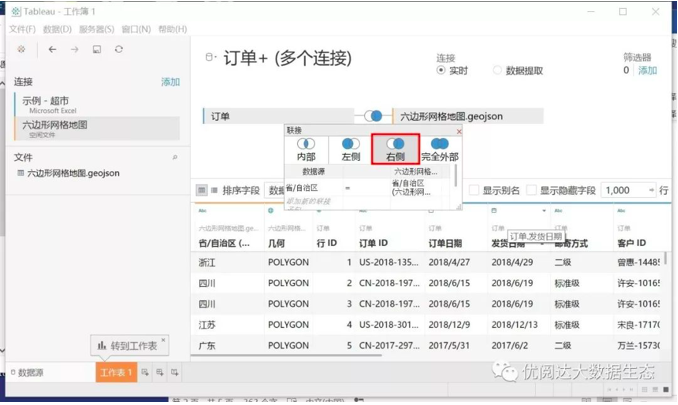
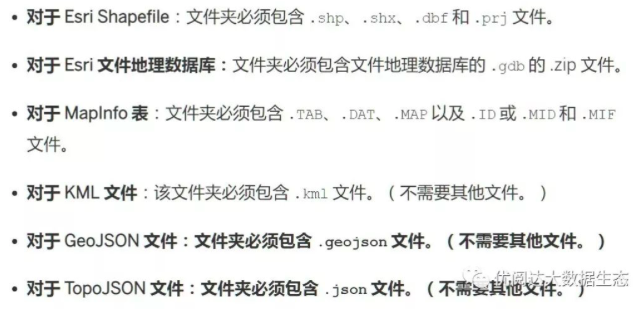
Tips: Note the following when connecting space files!
3, create chart
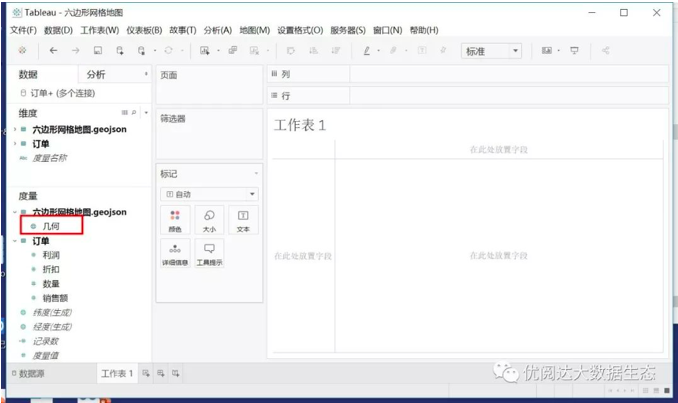
New worksheets, double-click the metrics "geometry" in the "Data" pane.
Then, drag and drop the dimension "provincial / autonomous region (hexagon mesh)" to "Tag" "" tag and "detailed information", and drag and drop the metric "Marker" card. .
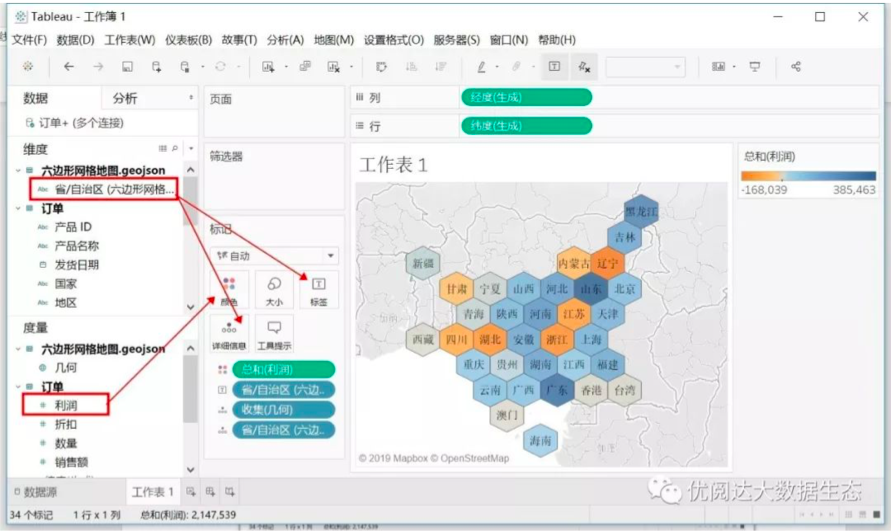
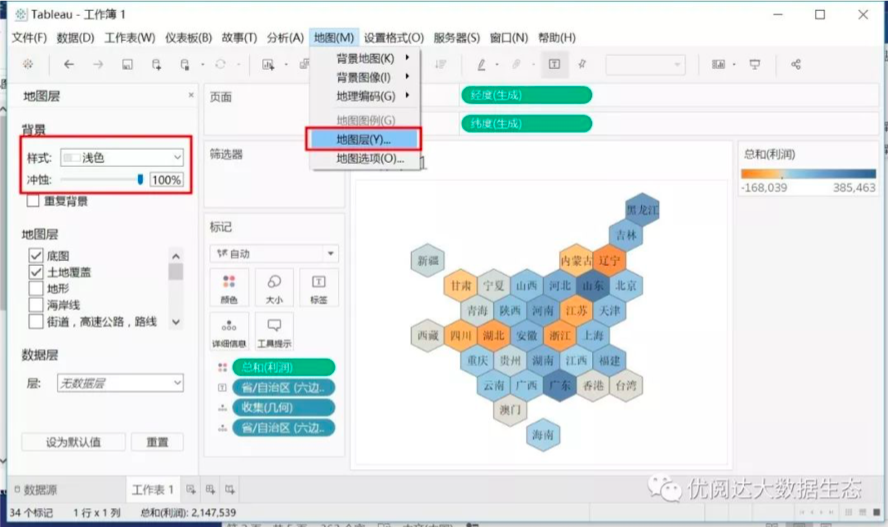
Click on the top menu bar "Map" - "Map Layer", on the left "map layer" pane, adjust "Error" in the "Background" to 100%:
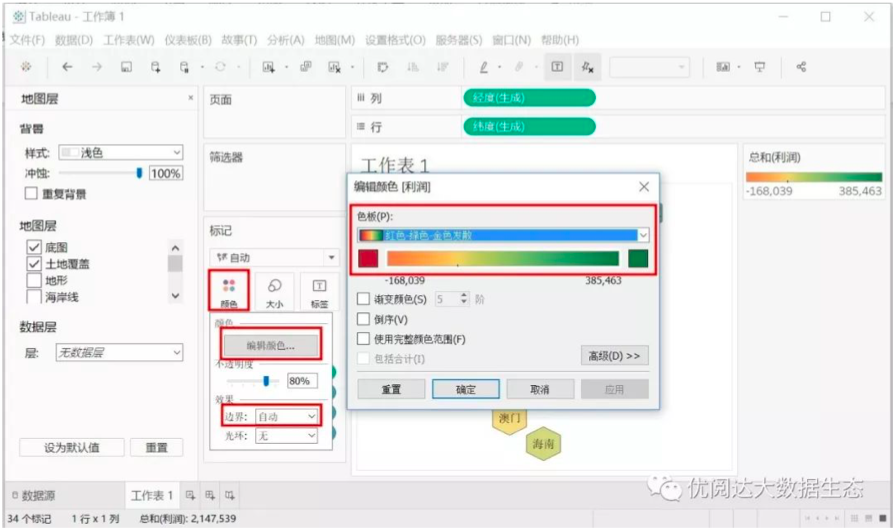
Click "Color" of the "Mark" card to change the "boundary" in the "Effect" in the pop-up window. Then, click Edit Colors, in the Edit Color [Profit] dialog box, change the color to "Red - Green - Golden Dissu", click OK.
In this way, the hexagon mesh map is completed.
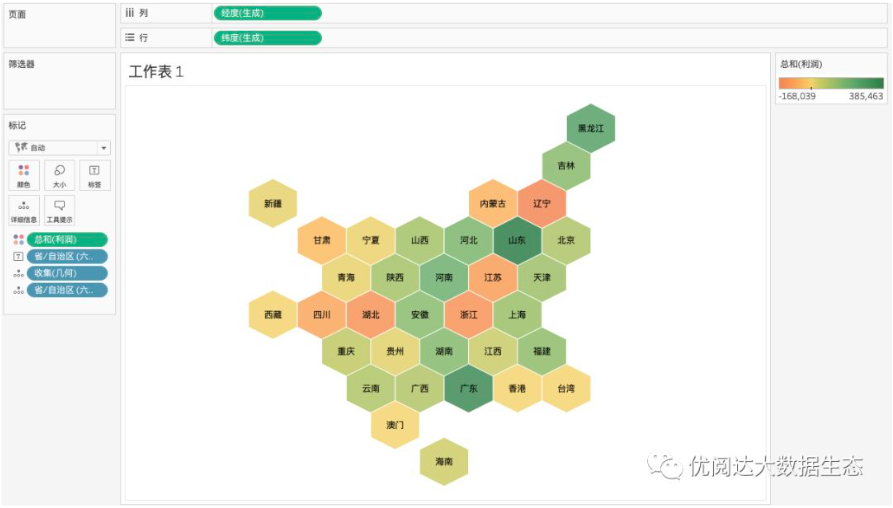
Tableau skills, have you get? Try it quickly!