Lift a chestnut! Tableau Trise (117): Total value of values with parameters
In the actual analysis business, there are many situations, we need to achieve the amount of money or quantity.
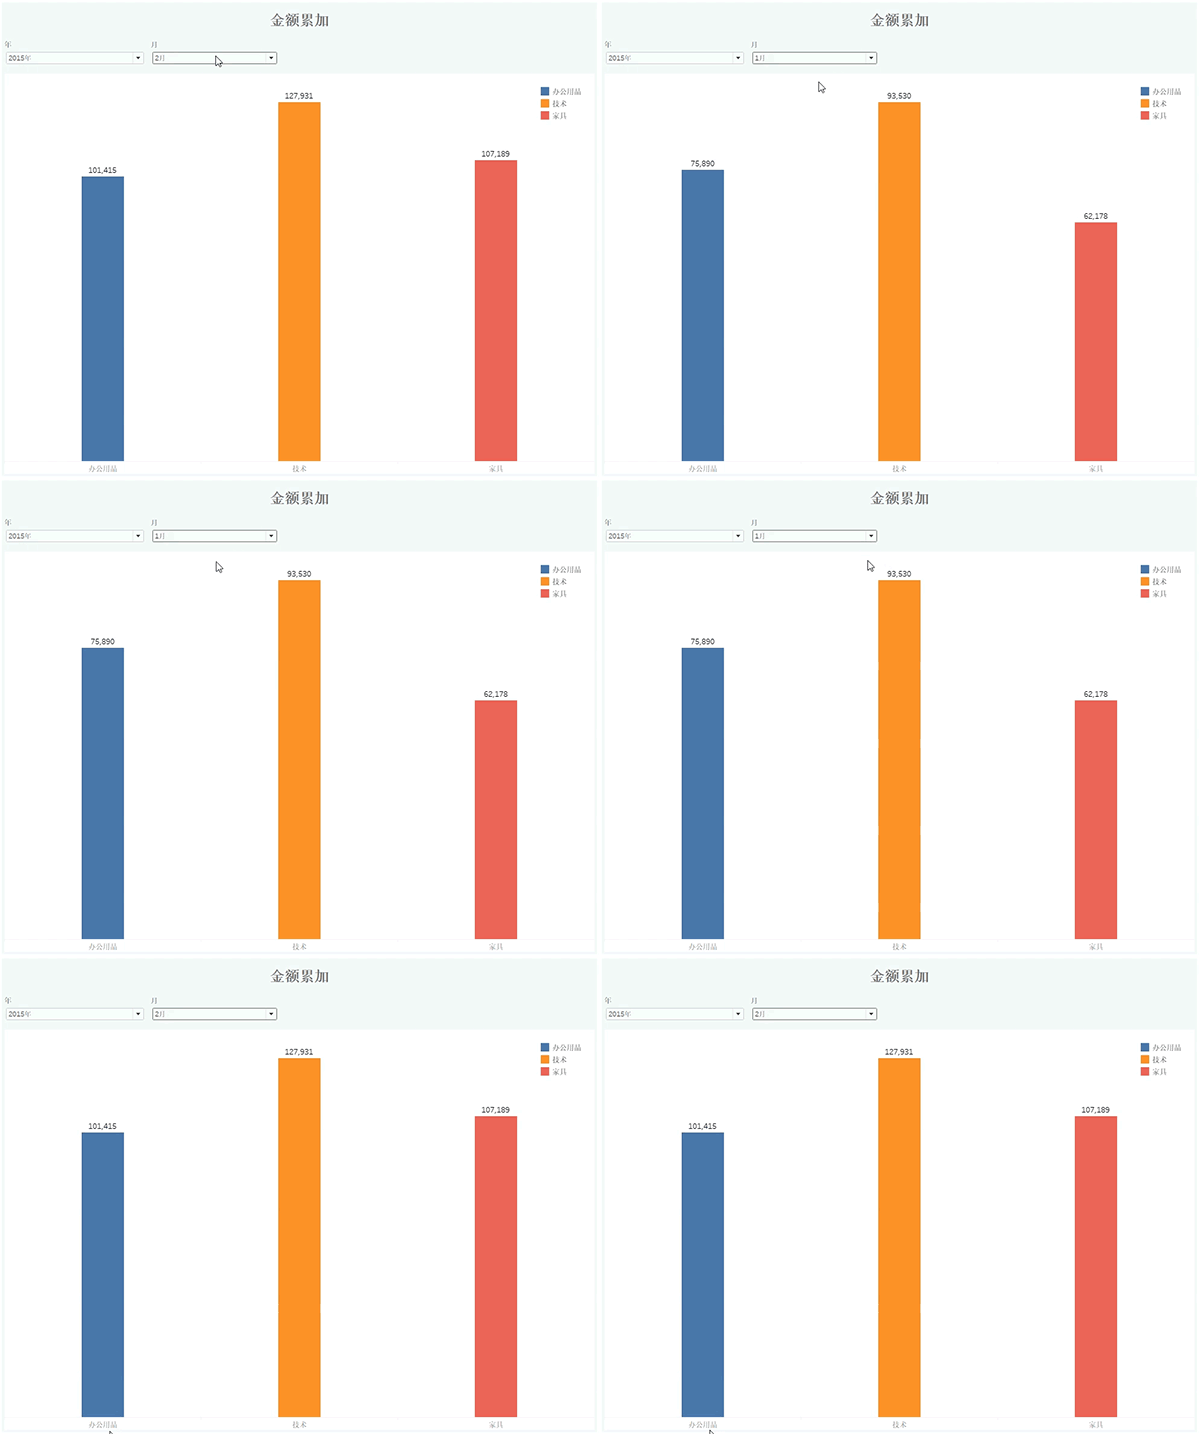
For example, the column chart below, we want to achieve the rendering effect: select the amount of sales of sales through the filter.
In January, the column chart only presents a 1 month of sales;
Choose February, the column chart will show a cumulative sales of 2 months;
Push ...

In Tableau, there are many ways to achieve numerical accumulation. We share a relatively convenient way today: use parameters. Sneakac!
The TABLEAU tricks that "lift a chestnut" and Ada want to share it with the accumulation of values with parameters.
For easy learning, chestnuts use the sample of Tableau to bring the sample - supermarket data source.
Specific steps are as follows:
01, first, you need to create a parameter: Click on the Triple Triangle on the right side of the dimension menu to select Create parameters.

Create two parameters separately: year and month.


02, then create a calculation field: amount is accumulated.
If Year ([Order Date]) = [Year] And Month ([Order Date]) <= [Month] THEN [Sales] END

03, then create a worksheet, dragging the category into columns, dragging the calculated field amount into the row, dragging the category to the color.
Then, set the label as a display tag tag;

Set the parameter and month for display parameter controls.

In this way, a column chart that can be achieved can be achieved.

Finally, put the worksheet into the dashboard, screen the look.

This issue of Tableau skills, have you get? Try it quickly!


