

Give a chestnut! Tableau Tips (80): Use a data bucket to achieve a fixed wheelbase of the chart
Recently, there are many data fans asking this question. For example, in the analysis of sales data, we may need to know: The number of orders or the number of customers in a certain range of sales needs to be fixed and equal in the wheelbase of the sales axis.
For example, in the figure below, we show that sales are at 0 through the histogram2500,2500For the number of orders in the range of 5000..., the wheelbase of the horizontal axis representing sales is fixed at 2500.

So, how does Tableau achieve a fixed wheelbase? This is not difficult, just use the data bucket function.
In this issue of "Give a Chestnut", the Tableau technique that Ada wants to share with you is: using a data bucket to achieve a fixed wheelbase of the chart.
To facilitate learning, we use the supermarket data source that comes with Tableau.
Specific steps are as follows:
Step 1:Create a data bucket
Import supermarket data, right-click "Sales-Create-Data Bucket", as shown in the figure.
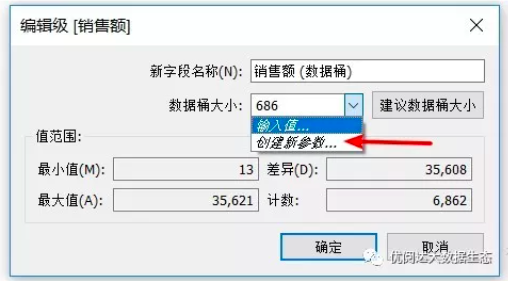
Tips: There is a recommended data bucket size in the data bucket, or you can manually set the data bucket size.
Step 2:Create parameters
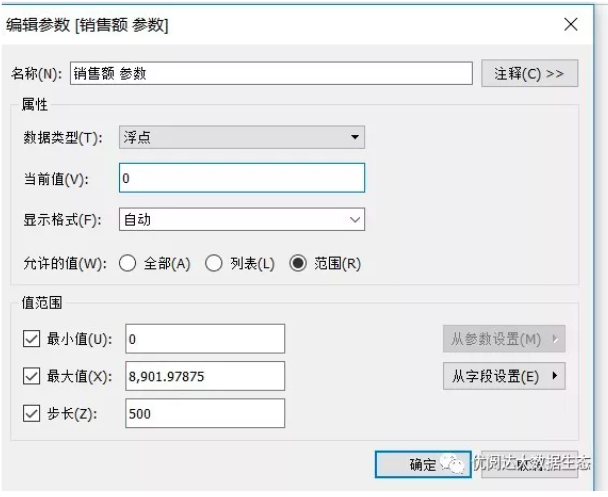
Click the data bucket size drop-down box to create a parameter. Here, select the range and you can manually change the minimum, maximum, and step length. After confirming, the parameter control will be displayed.
Step 3:Create a chart
Drag the sales amount (data bucket) to the row function, drag the order to the column function, and choose different counts.
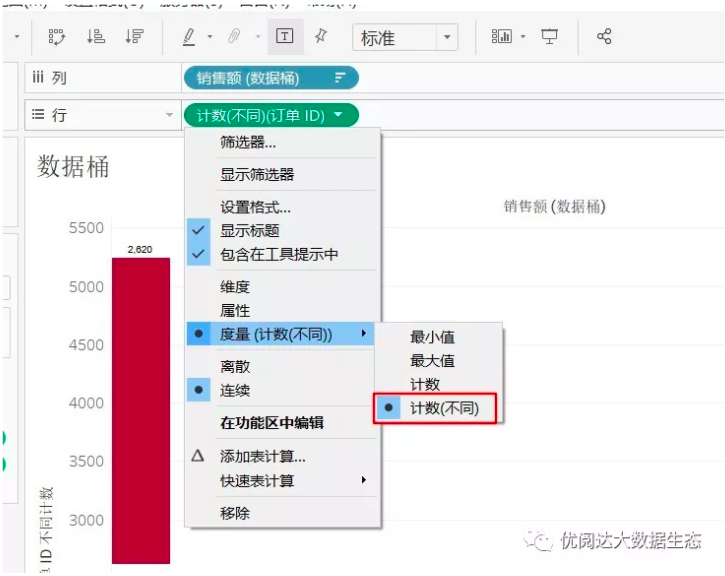
In the smart display, click the mark to select the Gantt chart, and drag the count (different) (order ID) to the mark size. Here you can slide the parameter control to control the step length of the data bucket, and you will get different effects.

Have you gotten the Tableau tips in this issue? Hurry up and open your Tableau and give it a try!