

Lift a chestnut! Tableau Trise (130): Alignment time using the detailed level (LOD) expression
Some Tableau users engaged in e-commerce or retail, proposed the following analysis requirements: I need to analyze multiple products, sales of different sales days, but the charts made (as shown below) are not intuitive enough.
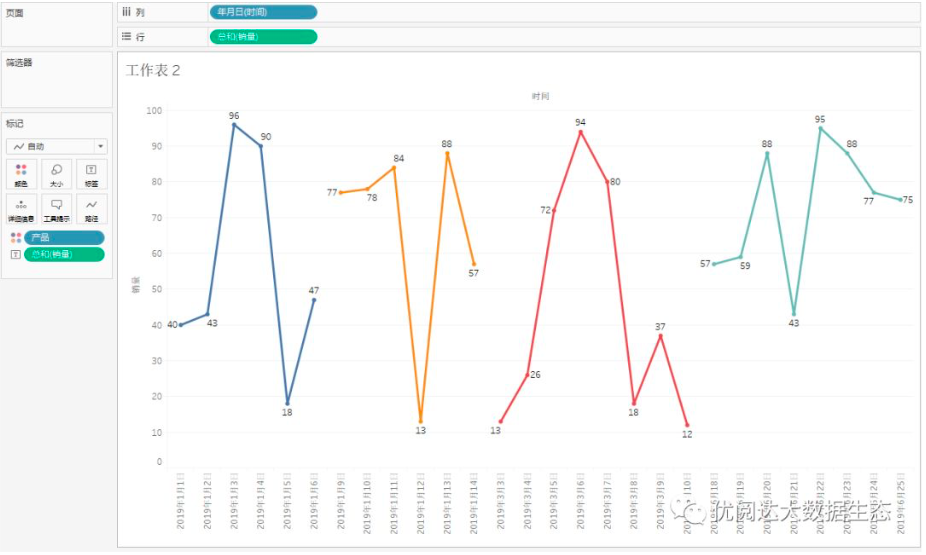
Indeed, in the case where the product type is not much and the data time span is small, the above figure is more easily viewed. However, if the product type is more, the time span is long, such a presented effect is not satisfactory.
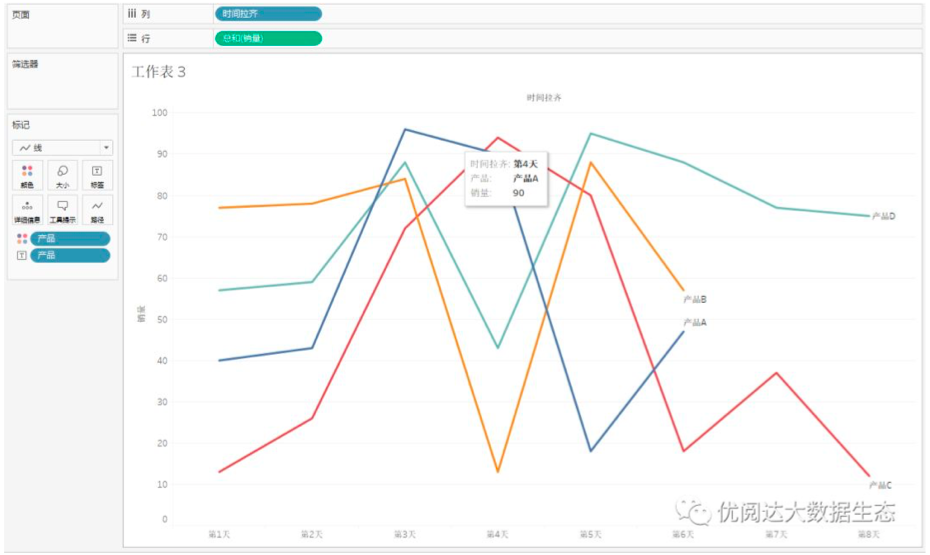
This scene, we will recommend users: Time to align, the first day of various types of product sales data, the contrast of such data will be more obvious, the effect is as follows:
So how do I achieve time? We need to use the detailed level expression, which is the LOD function.
The Tableau trick we want to share with you this issue is: Use the detailed level (LOD) expression to align time.
For easy learning, chestnuts use the self-propelled data source (as shown below). After mastering the chestnut method, the data powder can try to use its own data.

Specific steps are as follows:
1. Create a calculation field
Open Tableau Desktop to connect the chestnut data source. Then you need to create a calculation field.
First, calculate the start time of each product, the minimum time.
In the data pane, right click on the blank, select "Create" - "Calculate Field" in the drop-down menu. Name the calculation field "Minimum Time", type function:
{Fixed [Product]: min ([Time])}

Then, calculate the sales time of each product and the difference between the minimum time of their respective products.
In the data pane, right click on the blank, select "Create" - "Calculate Field" in the drop-down menu. Name the calculation field "time difference", type function:
Str (Datediff ('day', minimum time], [time]) + 1)
Tips: datediff function is calculated for two time difference, because the minimum time is first, the first day is equal to 0, so that thereafter add 1, display as the first day.

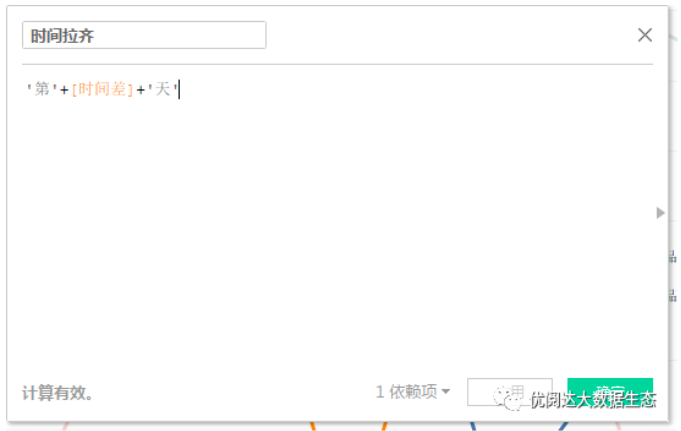
Next, create a "time Lati" calculation field.
In the data pane, right click on the blank, select "Create" - "Calculate Field" in the drop-down menu. Name the calculation field "Time Lati", type function:
'' '+ [Time difference] +' Day '
2, create a view
Drag and drop the calculated field "Time Lati" to the column, drag and drop the metrics "Sales" to the line, and drag and drop the dimension "product" to the color and label of the "Mark" card.
In this way, we realize time alignment, the following chart is not a more eye-catching?

This issue of Tableau skills, have you get? Try it quickly!