

Give a chestnut! Tableau Tips (90): Make your chart background transparent
along with Tableau 2018.3 releaseThe data powder looks forward to a long transparent background (as shown below) function can finally be used!

Many Tableau users want to know: In the latest version of Desktop, how to make the background transparent? Today, let's share this skill!
In this issue of "Give a Chestnut", Ada's Tableau trick to share with you is to make your chart background transparent.
For the convenience of learning, we use the supermarket data source that comes with Tableau.Note: This chestnut is suitable for Tableau 2018.3 and above. For lower version users please firstDownload the latest version of Tableaustudy again!
Specific steps are as follows:
1, create a chart
Open Tableau, add a data source table, and select the supermarket-order data source table. Then, drag the sales to the column, drag the category to the row, and drag the category to the color to generate the bar chart below.

2, insert the background image
Click the Add Dashboard button to create a new dashboard.
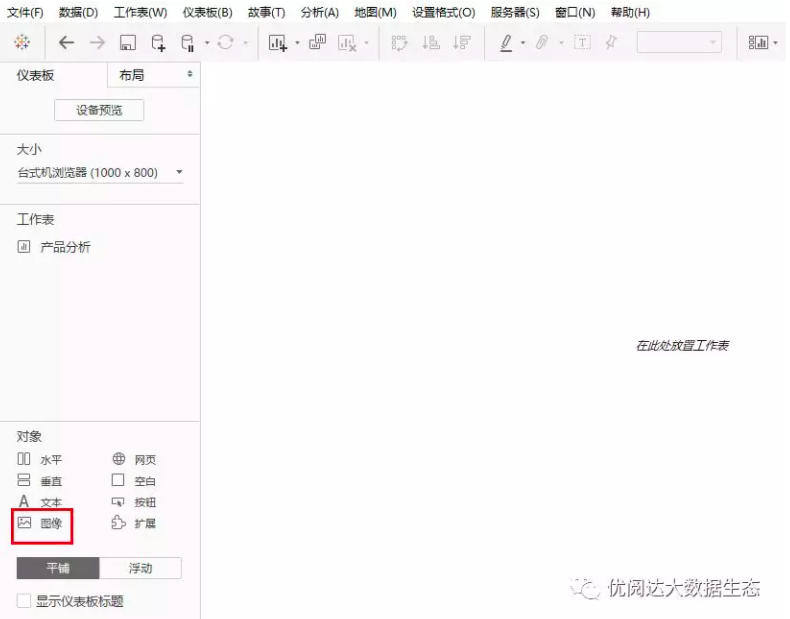
Next, double-click on "Image" at the bottom left of the dashboard to add your own background image (note that the size of the image matches the size of the dashboard).

Then, click on "tiling" at the bottom left of the dashboard, switch to float, pull the worksheet into the dashboard, and resize it to fill the entire page.

3, set the shadow format
Finally, open the drop-down menu "Settings" at the top and select "Shadow".

In the Set Shadow Format, set the default color of the workbook to None.

So, we will make the background of the chart transparent!

Today's Tableau trick, are you getting it?Open your Tableau and try it out!